Immigrants from Turkey vs Salvadoran Child Poverty Among Girls Under 16
COMPARE
Immigrants from Turkey
Salvadoran
Child Poverty Among Girls Under 16
Child Poverty Among Girls Under 16 Comparison
Immigrants from Turkey
Salvadorans
14.7%
CHILD POVERTY AMONG GIRLS UNDER 16
97.9/ 100
METRIC RATING
79th/ 347
METRIC RANK
19.4%
CHILD POVERTY AMONG GIRLS UNDER 16
0.2/ 100
METRIC RATING
258th/ 347
METRIC RANK
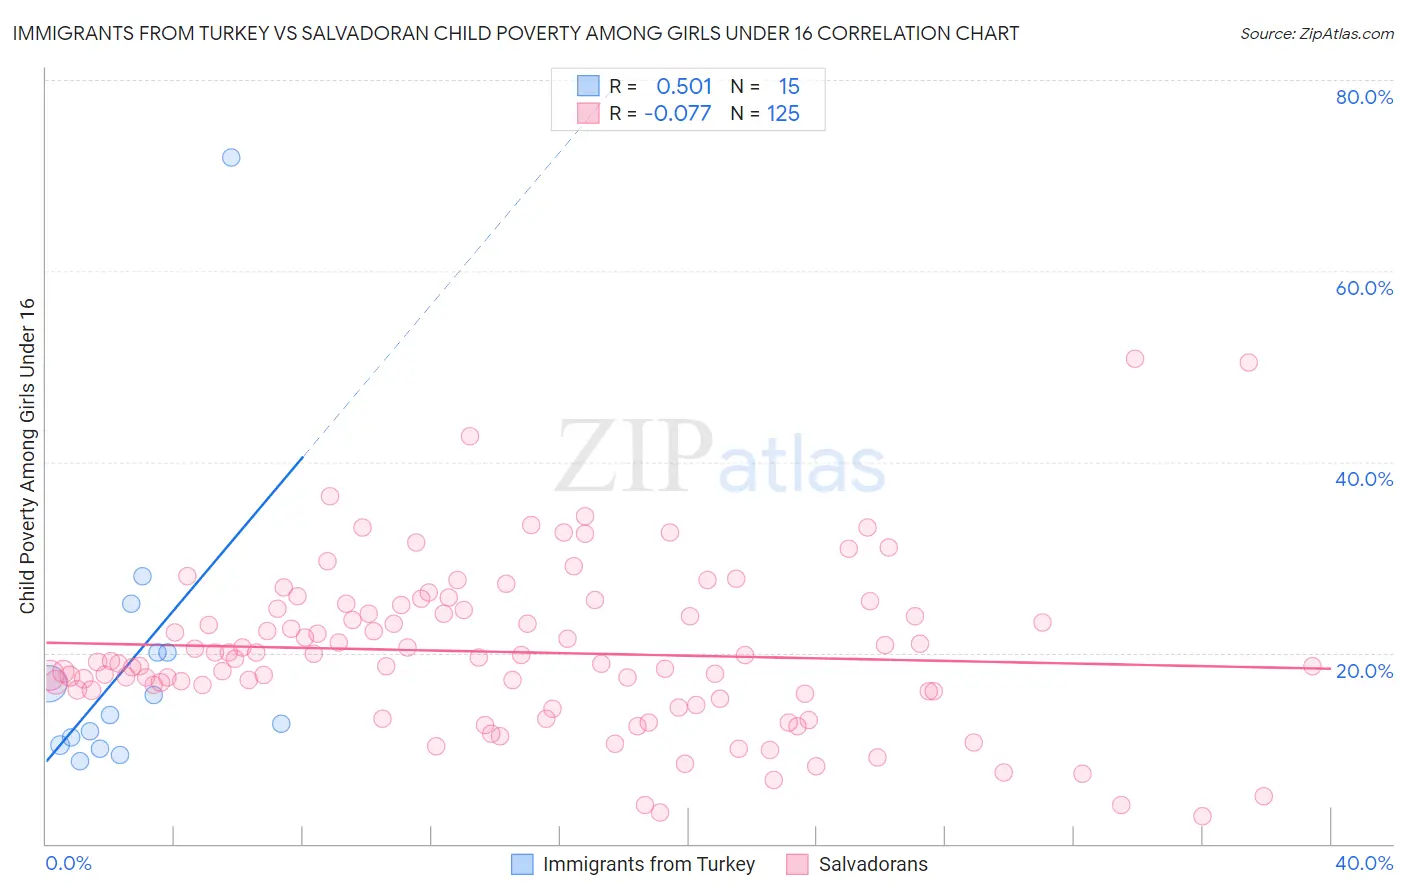
Immigrants from Turkey vs Salvadoran Child Poverty Among Girls Under 16 Correlation Chart
The statistical analysis conducted on geographies consisting of 219,871,426 people shows a substantial positive correlation between the proportion of Immigrants from Turkey and poverty level among girls under the age of 16 in the United States with a correlation coefficient (R) of 0.501 and weighted average of 14.7%. Similarly, the statistical analysis conducted on geographies consisting of 393,655,478 people shows a slight negative correlation between the proportion of Salvadorans and poverty level among girls under the age of 16 in the United States with a correlation coefficient (R) of -0.077 and weighted average of 19.4%, a difference of 32.2%.
Child Poverty Among Girls Under 16 Correlation Summary
| Measurement | Immigrants from Turkey | Salvadoran |
| Minimum | 8.6% | 2.8% |
| Maximum | 71.9% | 50.8% |
| Range | 63.3% | 48.0% |
| Mean | 19.0% | 20.1% |
| Median | 13.5% | 19.2% |
| Interquartile 25% (IQ1) | 10.3% | 15.8% |
| Interquartile 75% (IQ3) | 20.0% | 24.6% |
| Interquartile Range (IQR) | 9.7% | 8.8% |
| Standard Deviation (Sample) | 15.8% | 8.4% |
| Standard Deviation (Population) | 15.2% | 8.4% |
Similar Demographics by Child Poverty Among Girls Under 16
Demographics Similar to Immigrants from Turkey by Child Poverty Among Girls Under 16
In terms of child poverty among girls under 16, the demographic groups most similar to Immigrants from Turkey are Egyptian (14.7%, a difference of 0.0%), Tlingit-Haida (14.7%, a difference of 0.020%), Argentinean (14.7%, a difference of 0.020%), Immigrants from Russia (14.7%, a difference of 0.030%), and Immigrants from Eastern Europe (14.6%, a difference of 0.18%).
| Demographics | Rating | Rank | Child Poverty Among Girls Under 16 |
| Immigrants | Netherlands | 98.1 /100 | #72 | Exceptional 14.6% |
| Immigrants | Austria | 98.0 /100 | #73 | Exceptional 14.6% |
| Taiwanese | 98.0 /100 | #74 | Exceptional 14.6% |
| Immigrants | Eastern Europe | 98.0 /100 | #75 | Exceptional 14.6% |
| Immigrants | Russia | 97.9 /100 | #76 | Exceptional 14.7% |
| Tlingit-Haida | 97.9 /100 | #77 | Exceptional 14.7% |
| Argentineans | 97.9 /100 | #78 | Exceptional 14.7% |
| Immigrants | Turkey | 97.9 /100 | #79 | Exceptional 14.7% |
| Egyptians | 97.9 /100 | #80 | Exceptional 14.7% |
| Ukrainians | 97.7 /100 | #81 | Exceptional 14.7% |
| Macedonians | 97.6 /100 | #82 | Exceptional 14.7% |
| Immigrants | Italy | 97.4 /100 | #83 | Exceptional 14.8% |
| Soviet Union | 97.3 /100 | #84 | Exceptional 14.8% |
| Swiss | 97.2 /100 | #85 | Exceptional 14.8% |
| Australians | 97.2 /100 | #86 | Exceptional 14.8% |
Demographics Similar to Salvadorans by Child Poverty Among Girls Under 16
In terms of child poverty among girls under 16, the demographic groups most similar to Salvadorans are Ottawa (19.4%, a difference of 0.10%), Guyanese (19.4%, a difference of 0.13%), Trinidadian and Tobagonian (19.3%, a difference of 0.37%), Immigrants from Ecuador (19.3%, a difference of 0.44%), and Immigrants from Western Africa (19.3%, a difference of 0.46%).
| Demographics | Rating | Rank | Child Poverty Among Girls Under 16 |
| Immigrants | Trinidad and Tobago | 0.3 /100 | #251 | Tragic 19.2% |
| Immigrants | Middle Africa | 0.3 /100 | #252 | Tragic 19.2% |
| Immigrants | Guyana | 0.3 /100 | #253 | Tragic 19.3% |
| Immigrants | Western Africa | 0.3 /100 | #254 | Tragic 19.3% |
| Immigrants | Ecuador | 0.3 /100 | #255 | Tragic 19.3% |
| Trinidadians and Tobagonians | 0.2 /100 | #256 | Tragic 19.3% |
| Guyanese | 0.2 /100 | #257 | Tragic 19.4% |
| Salvadorans | 0.2 /100 | #258 | Tragic 19.4% |
| Ottawa | 0.2 /100 | #259 | Tragic 19.4% |
| Mexican American Indians | 0.2 /100 | #260 | Tragic 19.5% |
| Vietnamese | 0.2 /100 | #261 | Tragic 19.5% |
| Chickasaw | 0.1 /100 | #262 | Tragic 19.6% |
| Immigrants | Burma/Myanmar | 0.1 /100 | #263 | Tragic 19.7% |
| Jamaicans | 0.1 /100 | #264 | Tragic 19.7% |
| Immigrants | Jamaica | 0.1 /100 | #265 | Tragic 19.8% |