Armenian vs Immigrants from South Eastern Asia Married-Couple Family Poverty
COMPARE
Armenian
Immigrants from South Eastern Asia
Married-Couple Family Poverty
Married-Couple Family Poverty Comparison
Armenians
Immigrants from South Eastern Asia
5.5%
MARRIED-COUPLE FAMILY POVERTY
12.8/ 100
METRIC RATING
215th/ 347
METRIC RANK
5.1%
MARRIED-COUPLE FAMILY POVERTY
70.4/ 100
METRIC RATING
158th/ 347
METRIC RANK
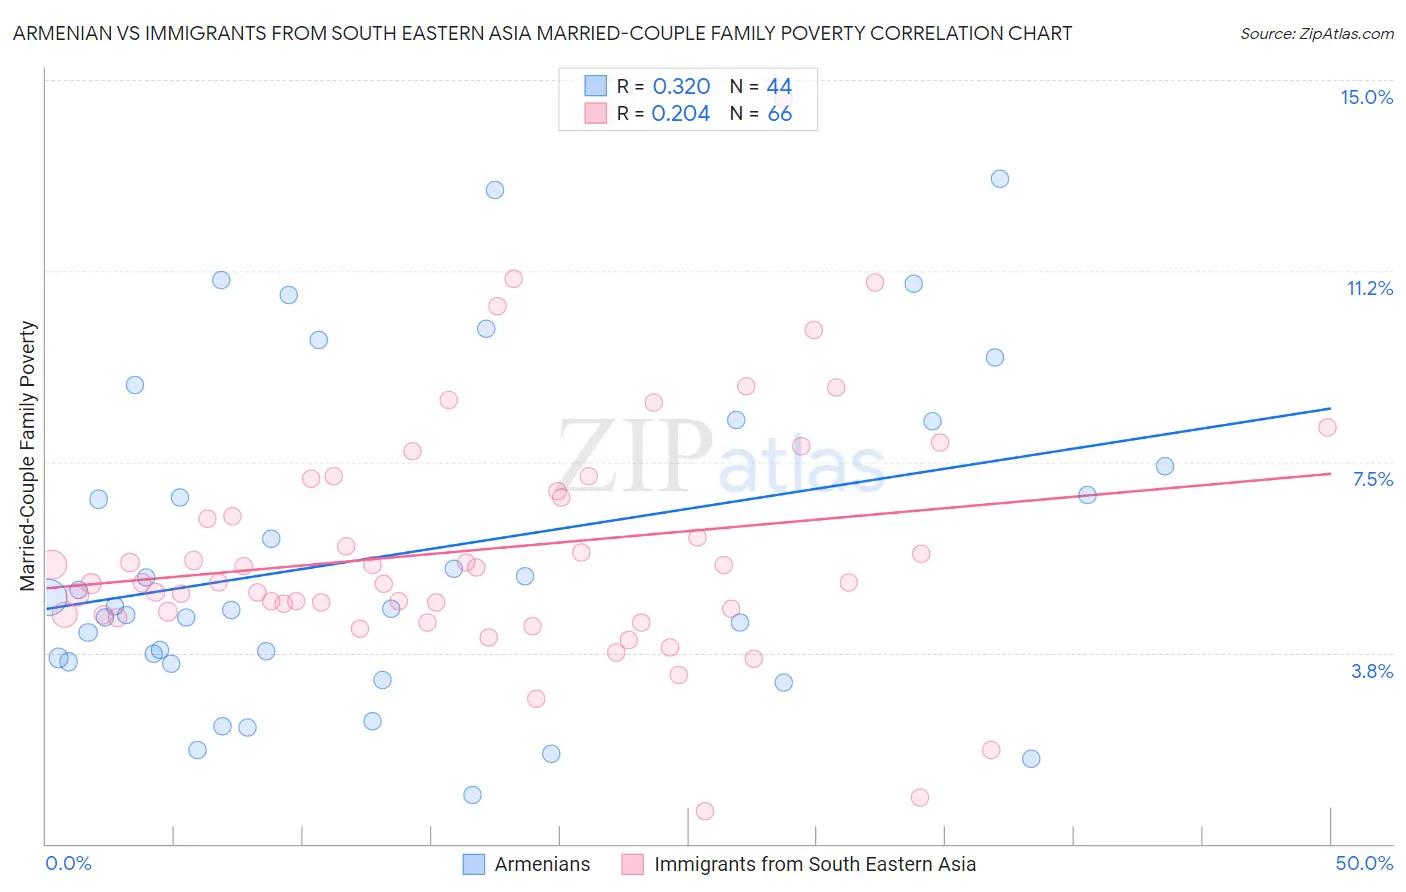
Armenian vs Immigrants from South Eastern Asia Married-Couple Family Poverty Correlation Chart
The statistical analysis conducted on geographies consisting of 308,319,420 people shows a mild positive correlation between the proportion of Armenians and poverty level among married-couple families in the United States with a correlation coefficient (R) of 0.320 and weighted average of 5.5%. Similarly, the statistical analysis conducted on geographies consisting of 504,926,469 people shows a weak positive correlation between the proportion of Immigrants from South Eastern Asia and poverty level among married-couple families in the United States with a correlation coefficient (R) of 0.204 and weighted average of 5.1%, a difference of 8.3%.
Married-Couple Family Poverty Correlation Summary
| Measurement | Armenian | Immigrants from South Eastern Asia |
| Minimum | 0.96% | 0.63% |
| Maximum | 13.1% | 14.6% |
| Range | 12.1% | 14.0% |
| Mean | 5.7% | 5.8% |
| Median | 4.7% | 5.1% |
| Interquartile 25% (IQ1) | 3.6% | 4.5% |
| Interquartile 75% (IQ3) | 7.9% | 6.9% |
| Interquartile Range (IQR) | 4.2% | 2.4% |
| Standard Deviation (Sample) | 3.1% | 2.4% |
| Standard Deviation (Population) | 3.1% | 2.4% |
Similar Demographics by Married-Couple Family Poverty
Demographics Similar to Armenians by Married-Couple Family Poverty
In terms of married-couple family poverty, the demographic groups most similar to Armenians are Iroquois (5.5%, a difference of 0.060%), Immigrants from Liberia (5.5%, a difference of 0.11%), Potawatomi (5.5%, a difference of 0.12%), Immigrants from Thailand (5.5%, a difference of 0.29%), and Nigerian (5.5%, a difference of 0.35%).
| Demographics | Rating | Rank | Married-Couple Family Poverty |
| French American Indians | 16.1 /100 | #208 | Poor 5.5% |
| Immigrants | Syria | 15.4 /100 | #209 | Poor 5.5% |
| Immigrants | Micronesia | 14.4 /100 | #210 | Poor 5.5% |
| Nigerians | 14.3 /100 | #211 | Poor 5.5% |
| Immigrants | Thailand | 14.0 /100 | #212 | Poor 5.5% |
| Immigrants | Liberia | 13.3 /100 | #213 | Poor 5.5% |
| Iroquois | 13.1 /100 | #214 | Poor 5.5% |
| Armenians | 12.8 /100 | #215 | Poor 5.5% |
| Potawatomi | 12.4 /100 | #216 | Poor 5.5% |
| Immigrants | Nigeria | 11.3 /100 | #217 | Poor 5.5% |
| Afghans | 11.2 /100 | #218 | Poor 5.5% |
| Japanese | 9.8 /100 | #219 | Tragic 5.6% |
| Colombians | 9.2 /100 | #220 | Tragic 5.6% |
| Panamanians | 9.2 /100 | #221 | Tragic 5.6% |
| Cajuns | 6.9 /100 | #222 | Tragic 5.6% |
Demographics Similar to Immigrants from South Eastern Asia by Married-Couple Family Poverty
In terms of married-couple family poverty, the demographic groups most similar to Immigrants from South Eastern Asia are Immigrants from Saudi Arabia (5.1%, a difference of 0.0%), Argentinean (5.1%, a difference of 0.050%), Pennsylvania German (5.1%, a difference of 0.26%), Sri Lankan (5.1%, a difference of 0.27%), and Immigrants from Ethiopia (5.1%, a difference of 0.31%).
| Demographics | Rating | Rank | Married-Couple Family Poverty |
| Immigrants | Cameroon | 77.3 /100 | #151 | Good 5.0% |
| Albanians | 77.2 /100 | #152 | Good 5.0% |
| Immigrants | Kuwait | 76.3 /100 | #153 | Good 5.0% |
| Delaware | 73.7 /100 | #154 | Good 5.1% |
| Immigrants | Ethiopia | 72.4 /100 | #155 | Good 5.1% |
| Sri Lankans | 72.2 /100 | #156 | Good 5.1% |
| Argentineans | 70.7 /100 | #157 | Good 5.1% |
| Immigrants | South Eastern Asia | 70.4 /100 | #158 | Good 5.1% |
| Immigrants | Saudi Arabia | 70.3 /100 | #159 | Good 5.1% |
| Pennsylvania Germans | 68.5 /100 | #160 | Good 5.1% |
| Ethiopians | 68.1 /100 | #161 | Good 5.1% |
| Immigrants | Jordan | 66.5 /100 | #162 | Good 5.1% |
| Sierra Leoneans | 64.1 /100 | #163 | Good 5.1% |
| Hawaiians | 62.3 /100 | #164 | Good 5.1% |
| Immigrants | Malaysia | 62.2 /100 | #165 | Good 5.1% |