Immigrants from Turkey vs Immigrants from South Eastern Asia Median Household Income
COMPARE
Immigrants from Turkey
Immigrants from South Eastern Asia
Median Household Income
Median Household Income Comparison
Immigrants from Turkey
Immigrants from South Eastern Asia
$96,964
MEDIAN HOUSEHOLD INCOME
100.0/ 100
METRIC RATING
41st/ 347
METRIC RANK
$91,541
MEDIAN HOUSEHOLD INCOME
98.4/ 100
METRIC RATING
99th/ 347
METRIC RANK
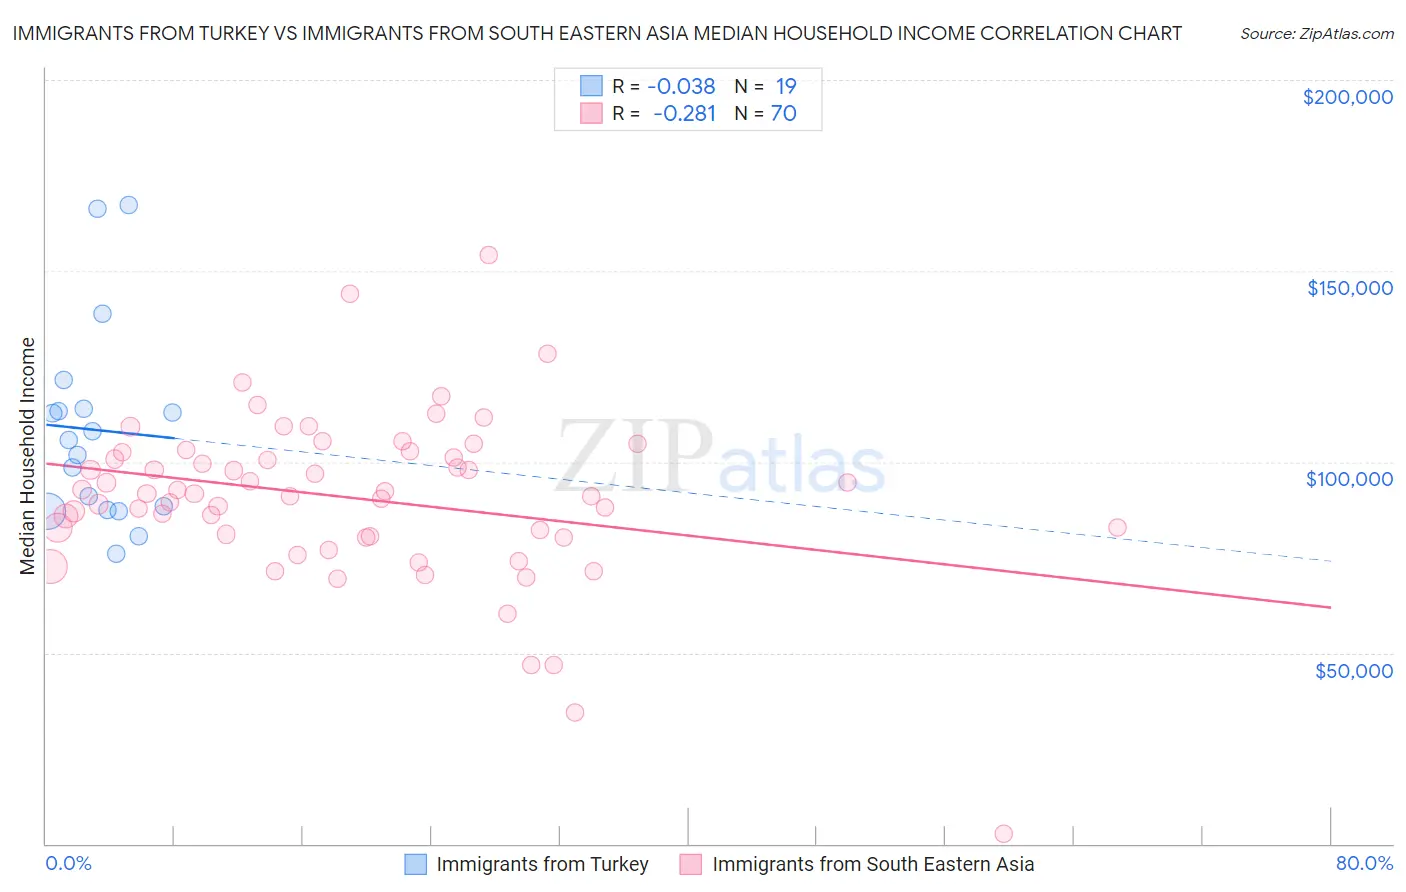
Immigrants from Turkey vs Immigrants from South Eastern Asia Median Household Income Correlation Chart
The statistical analysis conducted on geographies consisting of 222,938,856 people shows no correlation between the proportion of Immigrants from Turkey and median household income in the United States with a correlation coefficient (R) of -0.038 and weighted average of $96,964. Similarly, the statistical analysis conducted on geographies consisting of 511,972,128 people shows a weak negative correlation between the proportion of Immigrants from South Eastern Asia and median household income in the United States with a correlation coefficient (R) of -0.281 and weighted average of $91,541, a difference of 5.9%.
Median Household Income Correlation Summary
| Measurement | Immigrants from Turkey | Immigrants from South Eastern Asia |
| Minimum | $75,893 | $2,499 |
| Maximum | $167,317 | $154,011 |
| Range | $91,424 | $151,512 |
| Mean | $108,335 | $90,562 |
| Median | $105,608 | $91,713 |
| Interquartile 25% (IQ1) | $87,245 | $80,662 |
| Interquartile 75% (IQ3) | $113,867 | $102,441 |
| Interquartile Range (IQR) | $26,622 | $21,780 |
| Standard Deviation (Sample) | $25,883 | $22,276 |
| Standard Deviation (Population) | $25,193 | $22,116 |
Similar Demographics by Median Household Income
Demographics Similar to Immigrants from Turkey by Median Household Income
In terms of median household income, the demographic groups most similar to Immigrants from Turkey are Maltese ($97,015, a difference of 0.050%), Afghan ($97,026, a difference of 0.060%), Immigrants from Lithuania ($96,836, a difference of 0.13%), Immigrants from France ($96,743, a difference of 0.23%), and Immigrants from Greece ($96,675, a difference of 0.30%).
| Demographics | Rating | Rank | Median Household Income |
| Russians | 100.0 /100 | #34 | Exceptional $98,008 |
| Immigrants | Switzerland | 100.0 /100 | #35 | Exceptional $97,979 |
| Immigrants | Pakistan | 100.0 /100 | #36 | Exceptional $97,528 |
| Latvians | 100.0 /100 | #37 | Exceptional $97,311 |
| Immigrants | Indonesia | 100.0 /100 | #38 | Exceptional $97,297 |
| Afghans | 100.0 /100 | #39 | Exceptional $97,026 |
| Maltese | 100.0 /100 | #40 | Exceptional $97,015 |
| Immigrants | Turkey | 100.0 /100 | #41 | Exceptional $96,964 |
| Immigrants | Lithuania | 99.9 /100 | #42 | Exceptional $96,836 |
| Immigrants | France | 99.9 /100 | #43 | Exceptional $96,743 |
| Immigrants | Greece | 99.9 /100 | #44 | Exceptional $96,675 |
| Israelis | 99.9 /100 | #45 | Exceptional $96,552 |
| Australians | 99.9 /100 | #46 | Exceptional $96,490 |
| Immigrants | Russia | 99.9 /100 | #47 | Exceptional $96,378 |
| Cambodians | 99.9 /100 | #48 | Exceptional $96,324 |
Demographics Similar to Immigrants from South Eastern Asia by Median Household Income
In terms of median household income, the demographic groups most similar to Immigrants from South Eastern Asia are Immigrants from Southern Europe ($91,605, a difference of 0.070%), Ukrainian ($91,456, a difference of 0.090%), Immigrants from Moldova ($91,446, a difference of 0.10%), Immigrants from Serbia ($91,730, a difference of 0.21%), and Austrian ($91,339, a difference of 0.22%).
| Demographics | Rating | Rank | Median Household Income |
| Immigrants | Western Europe | 98.8 /100 | #92 | Exceptional $91,936 |
| Immigrants | Lebanon | 98.7 /100 | #93 | Exceptional $91,887 |
| Immigrants | North America | 98.7 /100 | #94 | Exceptional $91,860 |
| Armenians | 98.7 /100 | #95 | Exceptional $91,807 |
| Jordanians | 98.7 /100 | #96 | Exceptional $91,794 |
| Immigrants | Serbia | 98.6 /100 | #97 | Exceptional $91,730 |
| Immigrants | Southern Europe | 98.5 /100 | #98 | Exceptional $91,605 |
| Immigrants | South Eastern Asia | 98.4 /100 | #99 | Exceptional $91,541 |
| Ukrainians | 98.3 /100 | #100 | Exceptional $91,456 |
| Immigrants | Moldova | 98.3 /100 | #101 | Exceptional $91,446 |
| Austrians | 98.2 /100 | #102 | Exceptional $91,339 |
| Immigrants | Ukraine | 98.0 /100 | #103 | Exceptional $91,124 |
| Immigrants | Kazakhstan | 97.8 /100 | #104 | Exceptional $91,015 |
| Immigrants | Brazil | 97.7 /100 | #105 | Exceptional $90,907 |
| Macedonians | 97.4 /100 | #106 | Exceptional $90,761 |