Immigrants from St. Vincent and the Grenadines vs Marshallese 10th Grade
COMPARE
Immigrants from St. Vincent and the Grenadines
Marshallese
10th Grade
10th Grade Comparison
Immigrants from St. Vincent and the Grenadines
Marshallese
92.1%
10TH GRADE
0.0/ 100
METRIC RATING
283rd/ 347
METRIC RANK
93.6%
10TH GRADE
33.2/ 100
METRIC RATING
188th/ 347
METRIC RANK
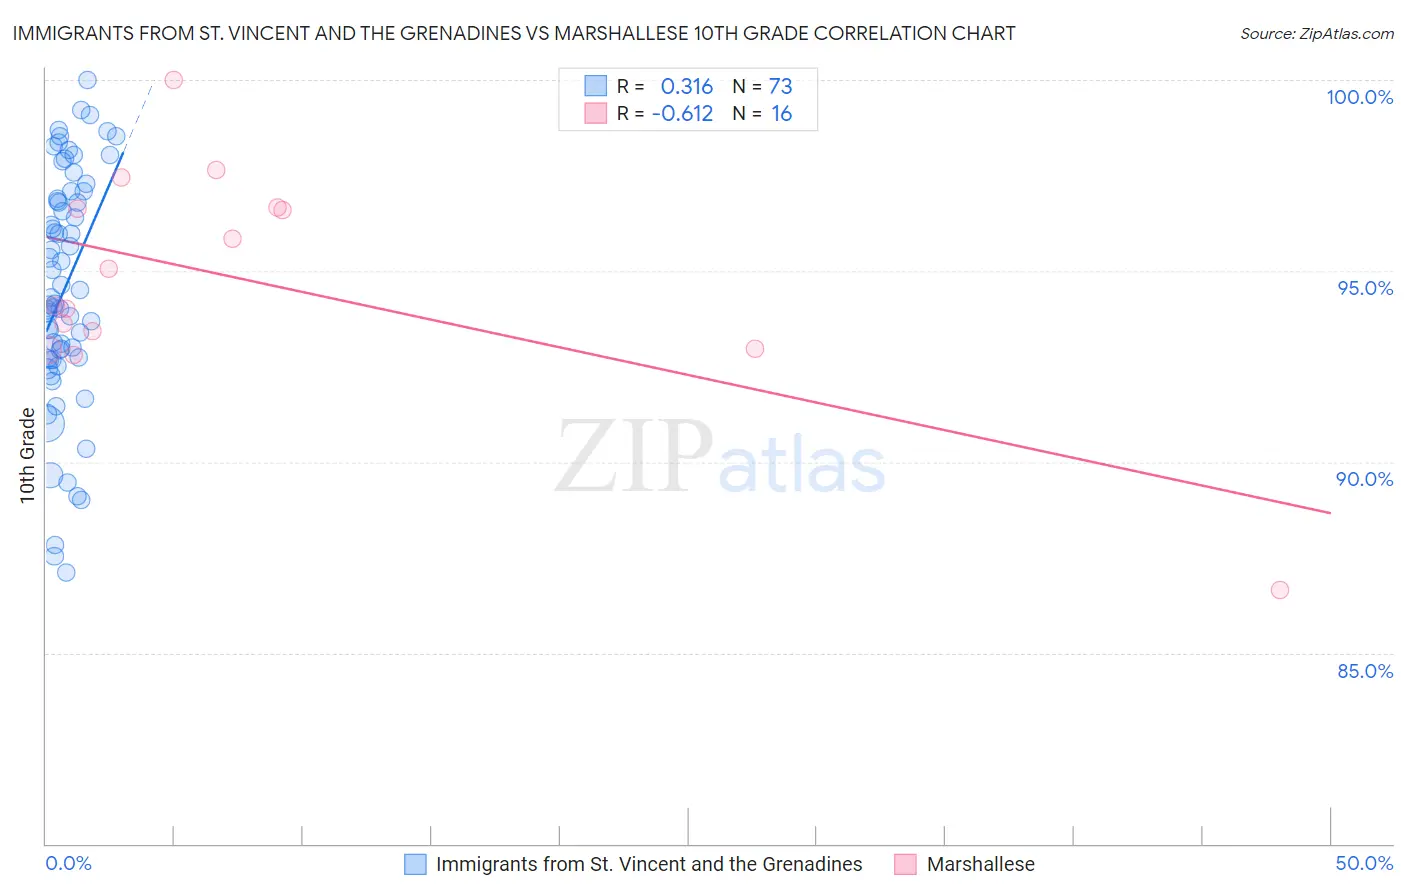
Immigrants from St. Vincent and the Grenadines vs Marshallese 10th Grade Correlation Chart
The statistical analysis conducted on geographies consisting of 56,191,418 people shows a mild positive correlation between the proportion of Immigrants from St. Vincent and the Grenadines and percentage of population with at least 10th grade education in the United States with a correlation coefficient (R) of 0.316 and weighted average of 92.1%. Similarly, the statistical analysis conducted on geographies consisting of 14,761,315 people shows a significant negative correlation between the proportion of Marshallese and percentage of population with at least 10th grade education in the United States with a correlation coefficient (R) of -0.612 and weighted average of 93.6%, a difference of 1.6%.
10th Grade Correlation Summary
| Measurement | Immigrants from St. Vincent and the Grenadines | Marshallese |
| Minimum | 87.1% | 86.6% |
| Maximum | 100.0% | 100.0% |
| Range | 12.9% | 13.4% |
| Mean | 94.5% | 94.8% |
| Median | 94.3% | 94.6% |
| Interquartile 25% (IQ1) | 92.7% | 93.2% |
| Interquartile 75% (IQ3) | 97.0% | 96.6% |
| Interquartile Range (IQR) | 4.3% | 3.4% |
| Standard Deviation (Sample) | 3.1% | 3.0% |
| Standard Deviation (Population) | 3.0% | 2.9% |
Similar Demographics by 10th Grade
Demographics Similar to Immigrants from St. Vincent and the Grenadines by 10th Grade
In terms of 10th grade, the demographic groups most similar to Immigrants from St. Vincent and the Grenadines are Immigrants from Barbados (92.1%, a difference of 0.020%), Immigrants from South Eastern Asia (92.1%, a difference of 0.030%), Immigrants from Peru (92.2%, a difference of 0.060%), Bangladeshi (92.2%, a difference of 0.080%), and Malaysian (92.2%, a difference of 0.090%).
| Demographics | Rating | Rank | 10th Grade |
| Immigrants | Trinidad and Tobago | 0.1 /100 | #276 | Tragic 92.3% |
| Navajo | 0.1 /100 | #277 | Tragic 92.3% |
| Barbadians | 0.1 /100 | #278 | Tragic 92.2% |
| Natives/Alaskans | 0.1 /100 | #279 | Tragic 92.2% |
| Malaysians | 0.1 /100 | #280 | Tragic 92.2% |
| Bangladeshis | 0.1 /100 | #281 | Tragic 92.2% |
| Immigrants | Peru | 0.1 /100 | #282 | Tragic 92.2% |
| Immigrants | St. Vincent and the Grenadines | 0.0 /100 | #283 | Tragic 92.1% |
| Immigrants | Barbados | 0.0 /100 | #284 | Tragic 92.1% |
| Immigrants | South Eastern Asia | 0.0 /100 | #285 | Tragic 92.1% |
| Yuman | 0.0 /100 | #286 | Tragic 92.0% |
| Pennsylvania Germans | 0.0 /100 | #287 | Tragic 91.9% |
| Immigrants | Laos | 0.0 /100 | #288 | Tragic 91.9% |
| Sri Lankans | 0.0 /100 | #289 | Tragic 91.8% |
| British West Indians | 0.0 /100 | #290 | Tragic 91.8% |
Demographics Similar to Marshallese by 10th Grade
In terms of 10th grade, the demographic groups most similar to Marshallese are Immigrants from Pakistan (93.6%, a difference of 0.010%), Laotian (93.6%, a difference of 0.010%), Immigrants from Eastern Asia (93.6%, a difference of 0.020%), Liberian (93.6%, a difference of 0.020%), and Yup'ik (93.6%, a difference of 0.020%).
| Demographics | Rating | Rank | 10th Grade |
| Immigrants | Northern Africa | 41.6 /100 | #181 | Average 93.7% |
| Colville | 38.8 /100 | #182 | Fair 93.6% |
| Guamanians/Chamorros | 37.1 /100 | #183 | Fair 93.6% |
| Choctaw | 36.6 /100 | #184 | Fair 93.6% |
| Sudanese | 36.6 /100 | #185 | Fair 93.6% |
| Immigrants | Eastern Asia | 35.1 /100 | #186 | Fair 93.6% |
| Liberians | 34.7 /100 | #187 | Fair 93.6% |
| Marshallese | 33.2 /100 | #188 | Fair 93.6% |
| Immigrants | Pakistan | 32.5 /100 | #189 | Fair 93.6% |
| Laotians | 32.1 /100 | #190 | Fair 93.6% |
| Yup'ik | 31.1 /100 | #191 | Fair 93.6% |
| Immigrants | Malaysia | 28.0 /100 | #192 | Fair 93.5% |
| Panamanians | 28.0 /100 | #193 | Fair 93.5% |
| Immigrants | Morocco | 26.9 /100 | #194 | Fair 93.5% |
| Cheyenne | 26.8 /100 | #195 | Fair 93.5% |