Immigrants from Kenya vs Taiwanese Married-Couple Family Poverty
COMPARE
Immigrants from Kenya
Taiwanese
Married-Couple Family Poverty
Married-Couple Family Poverty Comparison
Immigrants from Kenya
Taiwanese
4.9%
MARRIED-COUPLE FAMILY POVERTY
90.2/ 100
METRIC RATING
133rd/ 347
METRIC RANK
4.8%
MARRIED-COUPLE FAMILY POVERTY
94.8/ 100
METRIC RATING
115th/ 347
METRIC RANK
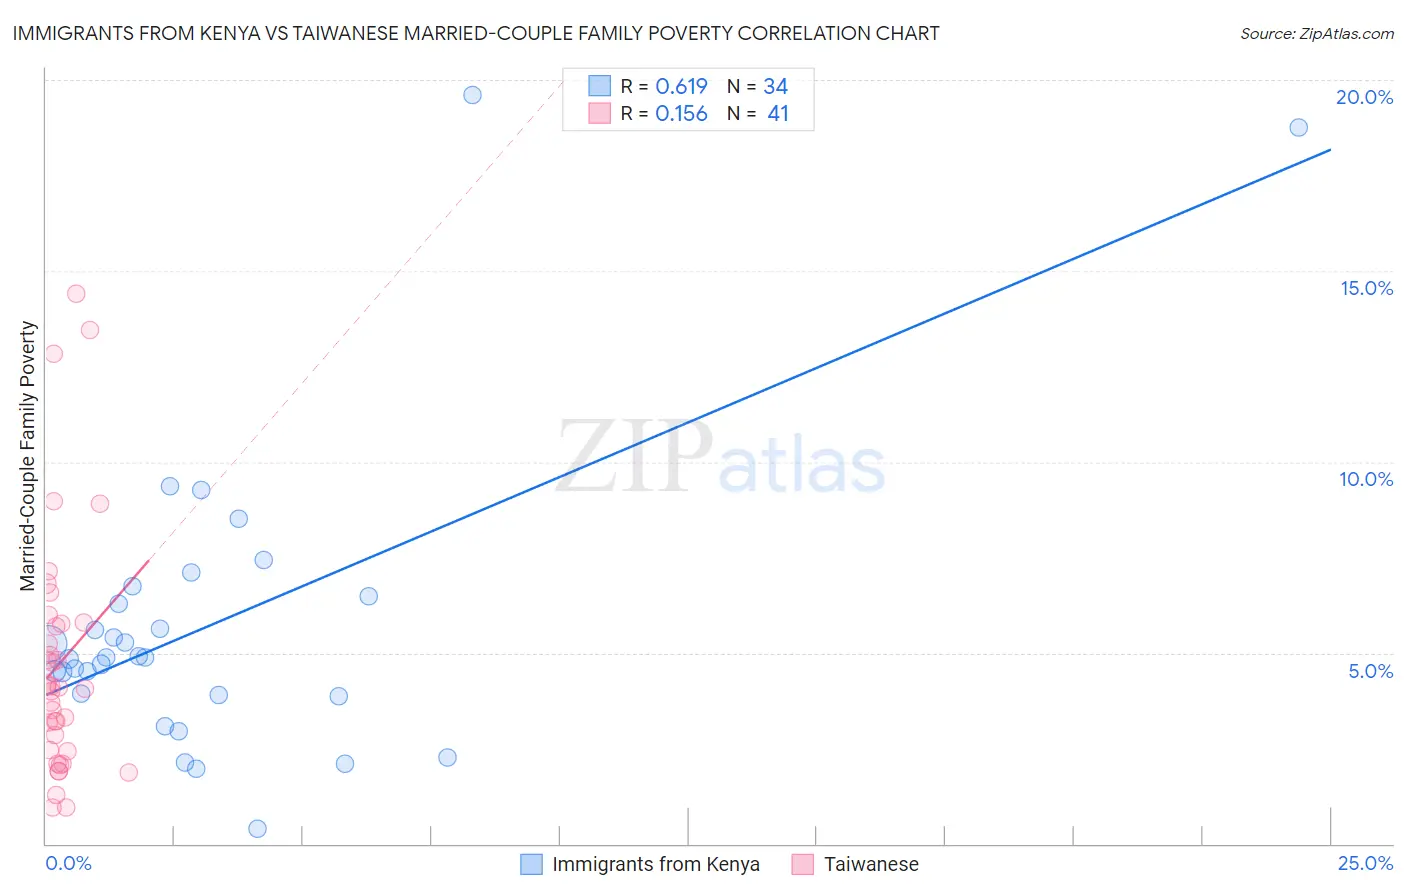
Immigrants from Kenya vs Taiwanese Married-Couple Family Poverty Correlation Chart
The statistical analysis conducted on geographies consisting of 217,162,212 people shows a significant positive correlation between the proportion of Immigrants from Kenya and poverty level among married-couple families in the United States with a correlation coefficient (R) of 0.619 and weighted average of 4.9%. Similarly, the statistical analysis conducted on geographies consisting of 31,702,060 people shows a poor positive correlation between the proportion of Taiwanese and poverty level among married-couple families in the United States with a correlation coefficient (R) of 0.156 and weighted average of 4.8%, a difference of 2.2%.
Married-Couple Family Poverty Correlation Summary
| Measurement | Immigrants from Kenya | Taiwanese |
| Minimum | 0.40% | 0.94% |
| Maximum | 19.6% | 14.4% |
| Range | 19.2% | 13.5% |
| Mean | 5.8% | 4.7% |
| Median | 4.9% | 4.1% |
| Interquartile 25% (IQ1) | 3.9% | 2.4% |
| Interquartile 75% (IQ3) | 6.5% | 5.8% |
| Interquartile Range (IQR) | 2.6% | 3.3% |
| Standard Deviation (Sample) | 4.0% | 3.2% |
| Standard Deviation (Population) | 3.9% | 3.1% |
Demographics Similar to Immigrants from Kenya and Taiwanese by Married-Couple Family Poverty
In terms of married-couple family poverty, the demographic groups most similar to Immigrants from Kenya are Samoan (4.9%, a difference of 0.010%), Puget Sound Salish (4.9%, a difference of 0.070%), Immigrants from Eastern Europe (4.9%, a difference of 0.090%), Soviet Union (4.9%, a difference of 0.15%), and Immigrants from Pakistan (4.9%, a difference of 0.16%). Similarly, the demographic groups most similar to Taiwanese are Celtic (4.8%, a difference of 0.010%), Kenyan (4.8%, a difference of 0.11%), Immigrants from Philippines (4.8%, a difference of 0.13%), Immigrants from Indonesia (4.8%, a difference of 0.15%), and Immigrants from Eastern Asia (4.8%, a difference of 0.50%).
| Demographics | Rating | Rank | Married-Couple Family Poverty |
| Immigrants | Indonesia | 95.1 /100 | #114 | Exceptional 4.8% |
| Taiwanese | 94.8 /100 | #115 | Exceptional 4.8% |
| Celtics | 94.8 /100 | #116 | Exceptional 4.8% |
| Kenyans | 94.7 /100 | #117 | Exceptional 4.8% |
| Immigrants | Philippines | 94.6 /100 | #118 | Exceptional 4.8% |
| Immigrants | Eastern Asia | 94.0 /100 | #119 | Exceptional 4.8% |
| Immigrants | Southern Europe | 93.4 /100 | #120 | Exceptional 4.8% |
| Indians (Asian) | 93.2 /100 | #121 | Exceptional 4.8% |
| Whites/Caucasians | 93.1 /100 | #122 | Exceptional 4.8% |
| Jordanians | 93.1 /100 | #123 | Exceptional 4.8% |
| Romanians | 92.5 /100 | #124 | Exceptional 4.8% |
| Immigrants | Bosnia and Herzegovina | 92.5 /100 | #125 | Exceptional 4.8% |
| Immigrants | Asia | 92.3 /100 | #126 | Exceptional 4.8% |
| Egyptians | 92.0 /100 | #127 | Exceptional 4.8% |
| Palestinians | 91.2 /100 | #128 | Exceptional 4.9% |
| Immigrants | Pakistan | 90.7 /100 | #129 | Exceptional 4.9% |
| Soviet Union | 90.7 /100 | #130 | Exceptional 4.9% |
| Immigrants | Eastern Europe | 90.5 /100 | #131 | Exceptional 4.9% |
| Puget Sound Salish | 90.4 /100 | #132 | Exceptional 4.9% |
| Immigrants | Kenya | 90.2 /100 | #133 | Exceptional 4.9% |
| Samoans | 90.2 /100 | #134 | Exceptional 4.9% |