Carpatho Rusyn vs Taiwanese Married-Couple Family Poverty
COMPARE
Carpatho Rusyn
Taiwanese
Married-Couple Family Poverty
Married-Couple Family Poverty Comparison
Carpatho Rusyns
Taiwanese
3.9%
MARRIED-COUPLE FAMILY POVERTY
100.0/ 100
METRIC RATING
10th/ 347
METRIC RANK
4.8%
MARRIED-COUPLE FAMILY POVERTY
94.8/ 100
METRIC RATING
115th/ 347
METRIC RANK
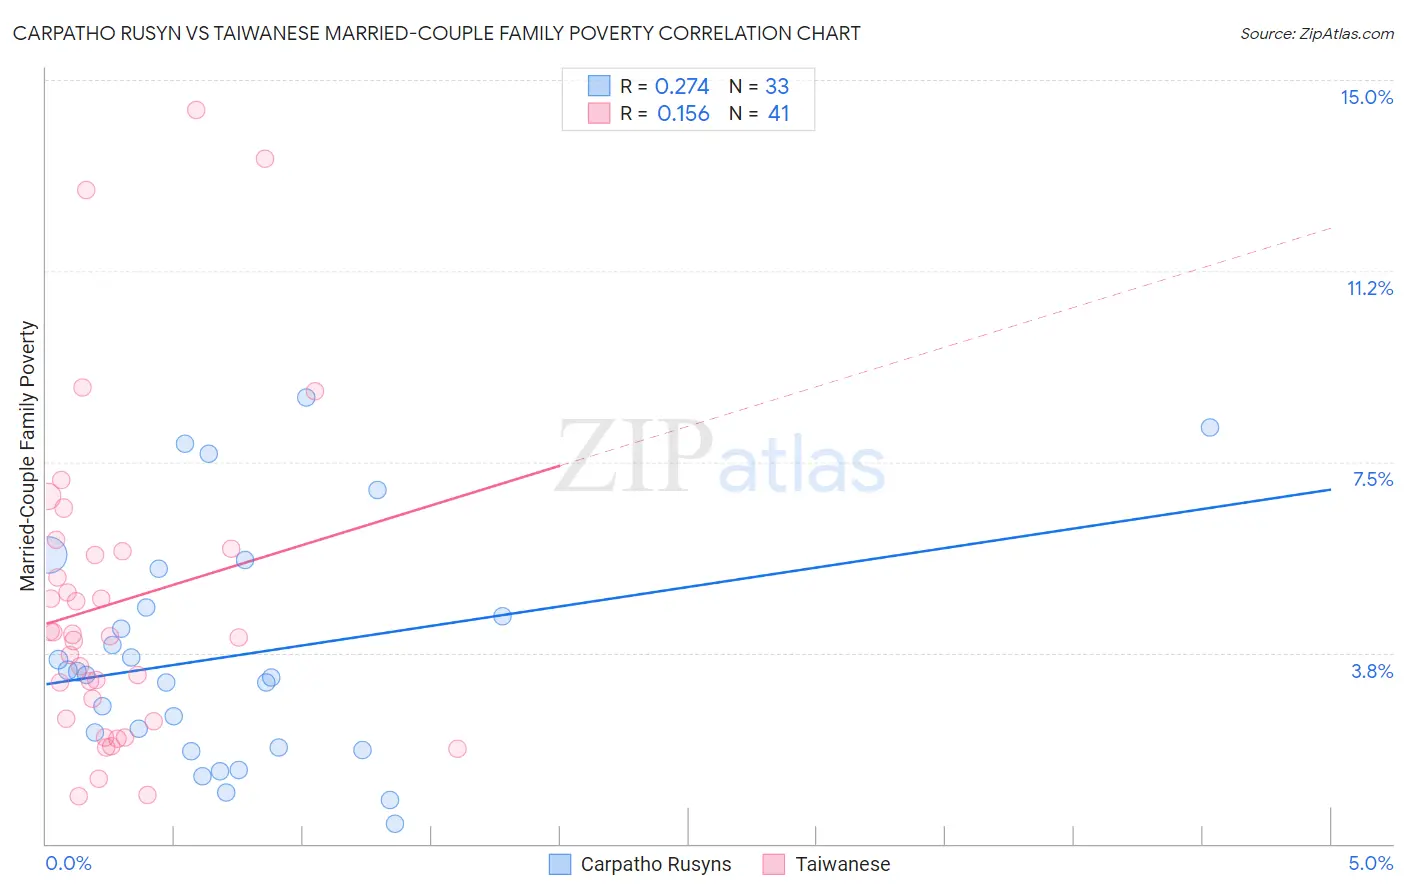
Carpatho Rusyn vs Taiwanese Married-Couple Family Poverty Correlation Chart
The statistical analysis conducted on geographies consisting of 58,607,667 people shows a weak positive correlation between the proportion of Carpatho Rusyns and poverty level among married-couple families in the United States with a correlation coefficient (R) of 0.274 and weighted average of 3.9%. Similarly, the statistical analysis conducted on geographies consisting of 31,702,060 people shows a poor positive correlation between the proportion of Taiwanese and poverty level among married-couple families in the United States with a correlation coefficient (R) of 0.156 and weighted average of 4.8%, a difference of 21.3%.
Married-Couple Family Poverty Correlation Summary
| Measurement | Carpatho Rusyn | Taiwanese |
| Minimum | 0.39% | 0.94% |
| Maximum | 8.8% | 14.4% |
| Range | 8.4% | 13.5% |
| Mean | 3.7% | 4.7% |
| Median | 3.3% | 4.1% |
| Interquartile 25% (IQ1) | 1.9% | 2.4% |
| Interquartile 75% (IQ3) | 5.0% | 5.8% |
| Interquartile Range (IQR) | 3.2% | 3.3% |
| Standard Deviation (Sample) | 2.2% | 3.2% |
| Standard Deviation (Population) | 2.2% | 3.1% |
Similar Demographics by Married-Couple Family Poverty
Demographics Similar to Carpatho Rusyns by Married-Couple Family Poverty
In terms of married-couple family poverty, the demographic groups most similar to Carpatho Rusyns are Croatian (3.9%, a difference of 0.050%), Thai (3.9%, a difference of 0.49%), Lithuanian (4.0%, a difference of 0.51%), Latvian (3.9%, a difference of 1.0%), and Bulgarian (4.0%, a difference of 1.2%).
| Demographics | Rating | Rank | Married-Couple Family Poverty |
| Norwegians | 100.0 /100 | #3 | Exceptional 3.7% |
| Slovenes | 100.0 /100 | #4 | Exceptional 3.8% |
| Swedes | 100.0 /100 | #5 | Exceptional 3.9% |
| Luxembourgers | 100.0 /100 | #6 | Exceptional 3.9% |
| Latvians | 100.0 /100 | #7 | Exceptional 3.9% |
| Thais | 100.0 /100 | #8 | Exceptional 3.9% |
| Croatians | 100.0 /100 | #9 | Exceptional 3.9% |
| Carpatho Rusyns | 100.0 /100 | #10 | Exceptional 3.9% |
| Lithuanians | 100.0 /100 | #11 | Exceptional 4.0% |
| Bulgarians | 100.0 /100 | #12 | Exceptional 4.0% |
| Czechs | 100.0 /100 | #13 | Exceptional 4.0% |
| Slovaks | 100.0 /100 | #14 | Exceptional 4.0% |
| Poles | 100.0 /100 | #15 | Exceptional 4.0% |
| Germans | 100.0 /100 | #16 | Exceptional 4.0% |
| Filipinos | 100.0 /100 | #17 | Exceptional 4.0% |
Demographics Similar to Taiwanese by Married-Couple Family Poverty
In terms of married-couple family poverty, the demographic groups most similar to Taiwanese are Celtic (4.8%, a difference of 0.010%), Kenyan (4.8%, a difference of 0.11%), Immigrants from Philippines (4.8%, a difference of 0.13%), Immigrants from Indonesia (4.8%, a difference of 0.15%), and Immigrants from Eastern Asia (4.8%, a difference of 0.50%).
| Demographics | Rating | Rank | Married-Couple Family Poverty |
| Laotians | 96.6 /100 | #108 | Exceptional 4.7% |
| Immigrants | Hong Kong | 96.4 /100 | #109 | Exceptional 4.7% |
| Immigrants | Bolivia | 96.2 /100 | #110 | Exceptional 4.7% |
| Pakistanis | 96.2 /100 | #111 | Exceptional 4.7% |
| Tongans | 95.9 /100 | #112 | Exceptional 4.7% |
| Immigrants | Nepal | 95.9 /100 | #113 | Exceptional 4.7% |
| Immigrants | Indonesia | 95.1 /100 | #114 | Exceptional 4.8% |
| Taiwanese | 94.8 /100 | #115 | Exceptional 4.8% |
| Celtics | 94.8 /100 | #116 | Exceptional 4.8% |
| Kenyans | 94.7 /100 | #117 | Exceptional 4.8% |
| Immigrants | Philippines | 94.6 /100 | #118 | Exceptional 4.8% |
| Immigrants | Eastern Asia | 94.0 /100 | #119 | Exceptional 4.8% |
| Immigrants | Southern Europe | 93.4 /100 | #120 | Exceptional 4.8% |
| Indians (Asian) | 93.2 /100 | #121 | Exceptional 4.8% |
| Whites/Caucasians | 93.1 /100 | #122 | Exceptional 4.8% |