Immigrants from Middle Africa vs Immigrants from Guyana Poverty
COMPARE
Immigrants from Middle Africa
Immigrants from Guyana
Poverty
Poverty Comparison
Immigrants from Middle Africa
Immigrants from Guyana
14.0%
POVERTY
0.4/ 100
METRIC RATING
240th/ 347
METRIC RANK
14.5%
POVERTY
0.1/ 100
METRIC RATING
265th/ 347
METRIC RANK
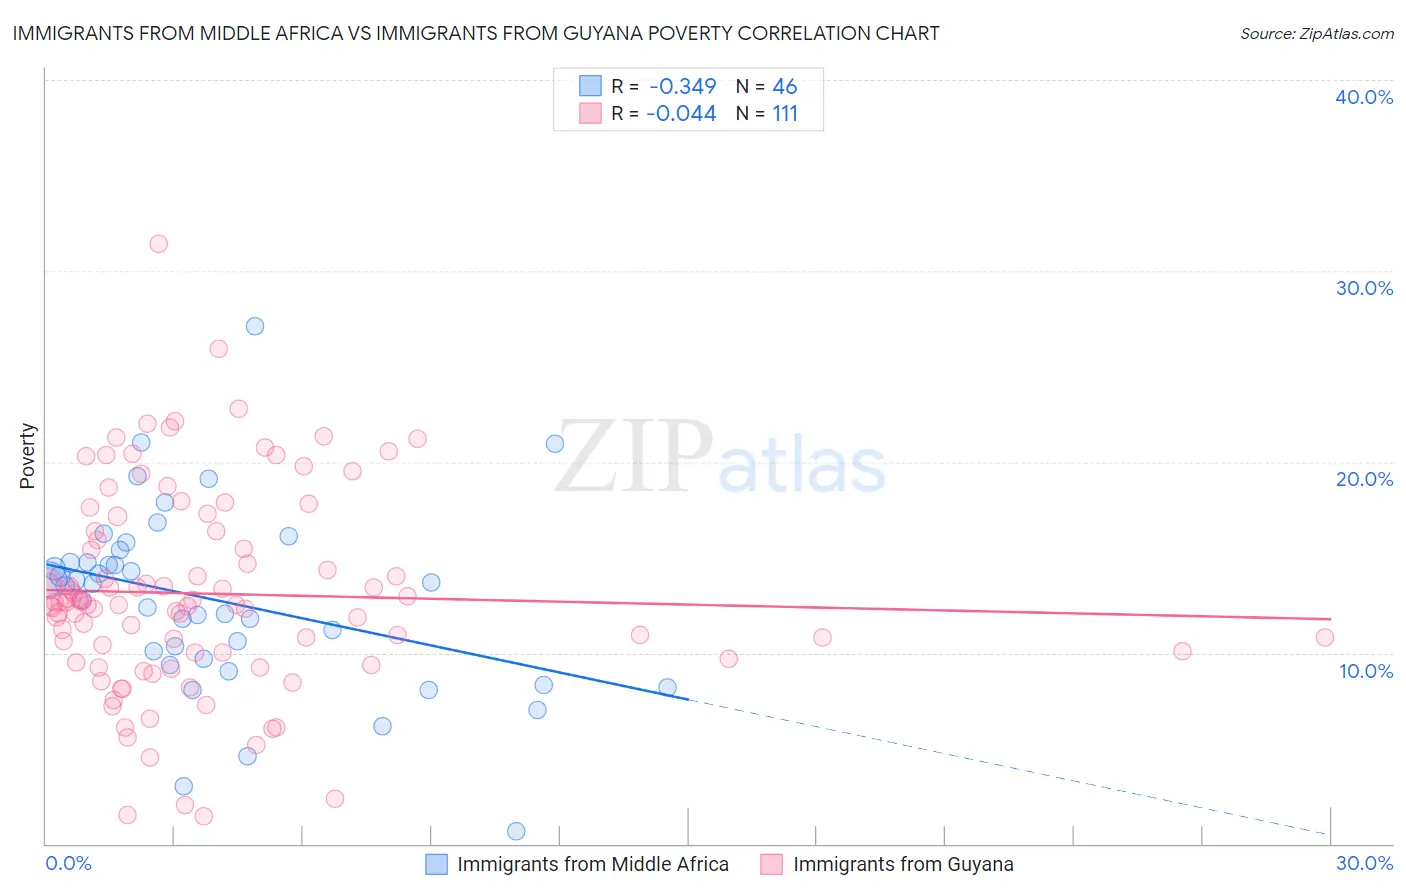
Immigrants from Middle Africa vs Immigrants from Guyana Poverty Correlation Chart
The statistical analysis conducted on geographies consisting of 202,643,852 people shows a mild negative correlation between the proportion of Immigrants from Middle Africa and poverty level in the United States with a correlation coefficient (R) of -0.349 and weighted average of 14.0%. Similarly, the statistical analysis conducted on geographies consisting of 183,648,527 people shows no correlation between the proportion of Immigrants from Guyana and poverty level in the United States with a correlation coefficient (R) of -0.044 and weighted average of 14.5%, a difference of 3.6%.
Poverty Correlation Summary
| Measurement | Immigrants from Middle Africa | Immigrants from Guyana |
| Minimum | 0.62% | 1.4% |
| Maximum | 27.1% | 31.4% |
| Range | 26.5% | 30.0% |
| Mean | 12.8% | 13.1% |
| Median | 13.6% | 12.6% |
| Interquartile 25% (IQ1) | 9.7% | 10.0% |
| Interquartile 75% (IQ3) | 14.7% | 16.4% |
| Interquartile Range (IQR) | 5.0% | 6.4% |
| Standard Deviation (Sample) | 4.9% | 5.3% |
| Standard Deviation (Population) | 4.8% | 5.2% |
Similar Demographics by Poverty
Demographics Similar to Immigrants from Middle Africa by Poverty
In terms of poverty, the demographic groups most similar to Immigrants from Middle Africa are Salvadoran (14.0%, a difference of 0.020%), Nicaraguan (13.9%, a difference of 0.12%), Ecuadorian (14.0%, a difference of 0.34%), Sudanese (14.0%, a difference of 0.41%), and Nepalese (14.0%, a difference of 0.44%).
| Demographics | Rating | Rank | Poverty |
| Immigrants | Saudi Arabia | 0.8 /100 | #233 | Tragic 13.8% |
| Immigrants | Laos | 0.7 /100 | #234 | Tragic 13.8% |
| Cubans | 0.6 /100 | #235 | Tragic 13.9% |
| Immigrants | Armenia | 0.5 /100 | #236 | Tragic 13.9% |
| French American Indians | 0.5 /100 | #237 | Tragic 13.9% |
| Ghanaians | 0.5 /100 | #238 | Tragic 13.9% |
| Nicaraguans | 0.4 /100 | #239 | Tragic 13.9% |
| Immigrants | Middle Africa | 0.4 /100 | #240 | Tragic 14.0% |
| Salvadorans | 0.4 /100 | #241 | Tragic 14.0% |
| Ecuadorians | 0.4 /100 | #242 | Tragic 14.0% |
| Sudanese | 0.3 /100 | #243 | Tragic 14.0% |
| Nepalese | 0.3 /100 | #244 | Tragic 14.0% |
| Immigrants | Sudan | 0.3 /100 | #245 | Tragic 14.1% |
| Potawatomi | 0.3 /100 | #246 | Tragic 14.1% |
| Liberians | 0.2 /100 | #247 | Tragic 14.1% |
Demographics Similar to Immigrants from Guyana by Poverty
In terms of poverty, the demographic groups most similar to Immigrants from Guyana are Immigrants from Jamaica (14.4%, a difference of 0.13%), Guyanese (14.5%, a difference of 0.17%), Jamaican (14.4%, a difference of 0.21%), Iroquois (14.5%, a difference of 0.49%), and Subsaharan African (14.5%, a difference of 0.52%).
| Demographics | Rating | Rank | Poverty |
| Ottawa | 0.1 /100 | #258 | Tragic 14.3% |
| Immigrants | Nicaragua | 0.1 /100 | #259 | Tragic 14.3% |
| Cape Verdeans | 0.1 /100 | #260 | Tragic 14.4% |
| Cherokee | 0.1 /100 | #261 | Tragic 14.4% |
| Immigrants | Liberia | 0.1 /100 | #262 | Tragic 14.4% |
| Jamaicans | 0.1 /100 | #263 | Tragic 14.4% |
| Immigrants | Jamaica | 0.1 /100 | #264 | Tragic 14.4% |
| Immigrants | Guyana | 0.1 /100 | #265 | Tragic 14.5% |
| Guyanese | 0.1 /100 | #266 | Tragic 14.5% |
| Iroquois | 0.1 /100 | #267 | Tragic 14.5% |
| Sub-Saharan Africans | 0.1 /100 | #268 | Tragic 14.5% |
| Immigrants | Cuba | 0.1 /100 | #269 | Tragic 14.6% |
| Central Americans | 0.1 /100 | #270 | Tragic 14.6% |
| Shoshone | 0.0 /100 | #271 | Tragic 14.7% |
| Chickasaw | 0.0 /100 | #272 | Tragic 14.7% |