Immigrants from Hong Kong vs Yup'ik Married-Couple Family Poverty
COMPARE
Immigrants from Hong Kong
Yup'ik
Married-Couple Family Poverty
Married-Couple Family Poverty Comparison
Immigrants from Hong Kong
Yup'ik
4.7%
MARRIED-COUPLE FAMILY POVERTY
96.4/ 100
METRIC RATING
109th/ 347
METRIC RANK
13.4%
MARRIED-COUPLE FAMILY POVERTY
0.0/ 100
METRIC RATING
347th/ 347
METRIC RANK
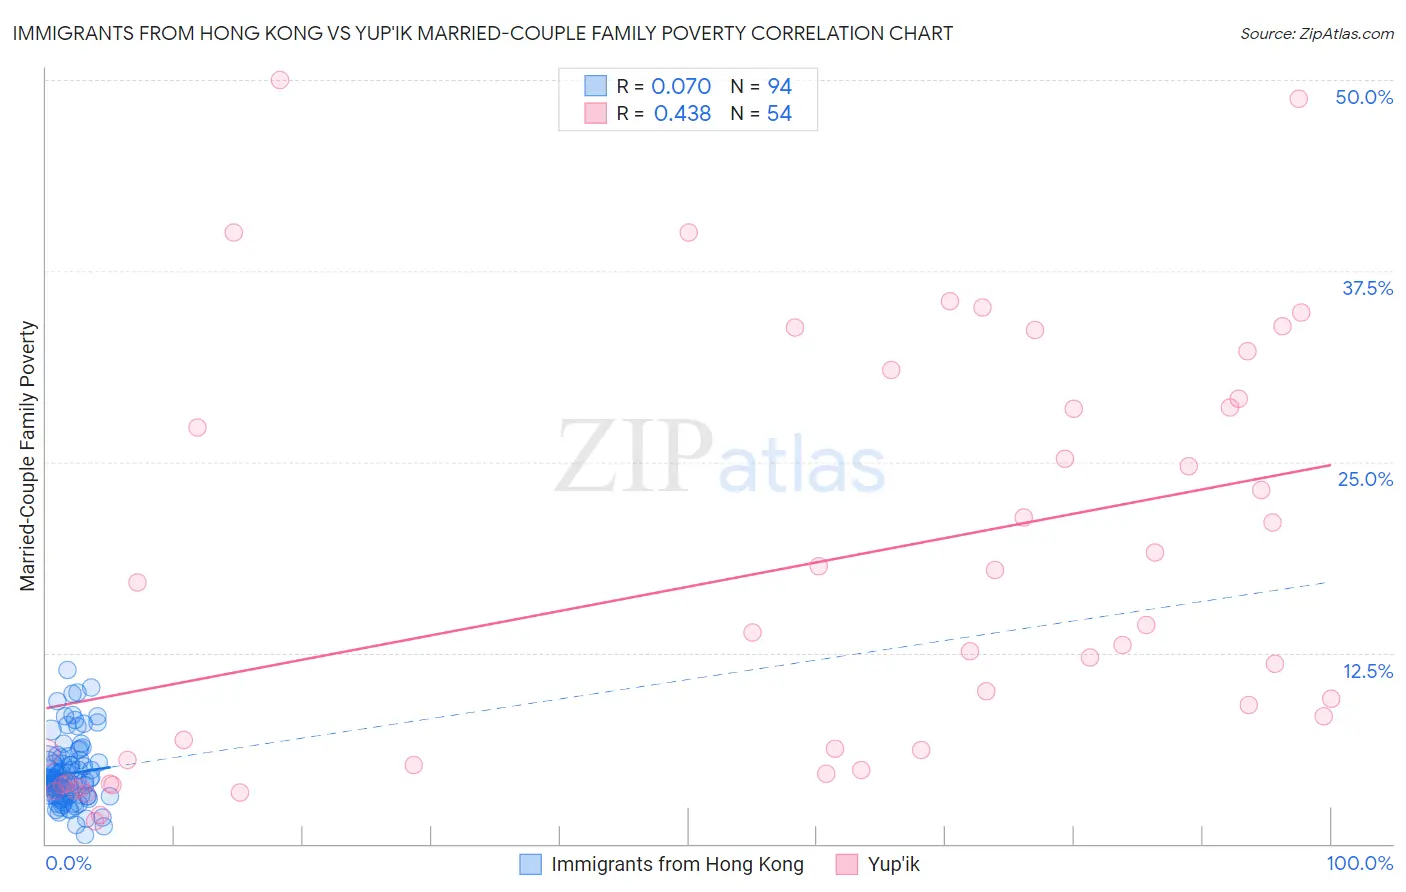
Immigrants from Hong Kong vs Yup'ik Married-Couple Family Poverty Correlation Chart
The statistical analysis conducted on geographies consisting of 252,495,550 people shows a slight positive correlation between the proportion of Immigrants from Hong Kong and poverty level among married-couple families in the United States with a correlation coefficient (R) of 0.070 and weighted average of 4.7%. Similarly, the statistical analysis conducted on geographies consisting of 39,863,865 people shows a moderate positive correlation between the proportion of Yup'ik and poverty level among married-couple families in the United States with a correlation coefficient (R) of 0.438 and weighted average of 13.4%, a difference of 183.6%.
Married-Couple Family Poverty Correlation Summary
| Measurement | Immigrants from Hong Kong | Yup'ik |
| Minimum | 0.53% | 1.5% |
| Maximum | 11.4% | 50.0% |
| Range | 10.8% | 48.5% |
| Mean | 4.6% | 17.5% |
| Median | 4.1% | 13.4% |
| Interquartile 25% (IQ1) | 3.1% | 5.1% |
| Interquartile 75% (IQ3) | 5.3% | 28.6% |
| Interquartile Range (IQR) | 2.2% | 23.4% |
| Standard Deviation (Sample) | 2.2% | 13.4% |
| Standard Deviation (Population) | 2.1% | 13.3% |
Similar Demographics by Married-Couple Family Poverty
Demographics Similar to Immigrants from Hong Kong by Married-Couple Family Poverty
In terms of married-couple family poverty, the demographic groups most similar to Immigrants from Hong Kong are Immigrants from Bolivia (4.7%, a difference of 0.16%), Laotian (4.7%, a difference of 0.20%), Pakistani (4.7%, a difference of 0.20%), Tongan (4.7%, a difference of 0.38%), and Immigrants from Nepal (4.7%, a difference of 0.45%).
| Demographics | Rating | Rank | Married-Couple Family Poverty |
| Asians | 97.6 /100 | #102 | Exceptional 4.7% |
| Immigrants | Romania | 97.3 /100 | #103 | Exceptional 4.7% |
| Immigrants | Moldova | 97.1 /100 | #104 | Exceptional 4.7% |
| Aleuts | 97.0 /100 | #105 | Exceptional 4.7% |
| Immigrants | France | 96.9 /100 | #106 | Exceptional 4.7% |
| Immigrants | Germany | 96.8 /100 | #107 | Exceptional 4.7% |
| Laotians | 96.6 /100 | #108 | Exceptional 4.7% |
| Immigrants | Hong Kong | 96.4 /100 | #109 | Exceptional 4.7% |
| Immigrants | Bolivia | 96.2 /100 | #110 | Exceptional 4.7% |
| Pakistanis | 96.2 /100 | #111 | Exceptional 4.7% |
| Tongans | 95.9 /100 | #112 | Exceptional 4.7% |
| Immigrants | Nepal | 95.9 /100 | #113 | Exceptional 4.7% |
| Immigrants | Indonesia | 95.1 /100 | #114 | Exceptional 4.8% |
| Taiwanese | 94.8 /100 | #115 | Exceptional 4.8% |
| Celtics | 94.8 /100 | #116 | Exceptional 4.8% |
Demographics Similar to Yup'ik by Married-Couple Family Poverty
In terms of married-couple family poverty, the demographic groups most similar to Yup'ik are Immigrants from Yemen (12.8%, a difference of 4.6%), Puerto Rican (12.6%, a difference of 6.0%), Navajo (11.9%, a difference of 13.0%), Pima (11.4%, a difference of 17.4%), and Tohono O'odham (11.2%, a difference of 19.3%).
| Demographics | Rating | Rank | Married-Couple Family Poverty |
| Lumbee | 0.0 /100 | #333 | Tragic 8.3% |
| Immigrants | Dominican Republic | 0.0 /100 | #334 | Tragic 8.4% |
| Sioux | 0.0 /100 | #335 | Tragic 8.7% |
| Apache | 0.0 /100 | #336 | Tragic 9.0% |
| Yakama | 0.0 /100 | #337 | Tragic 9.0% |
| Cheyenne | 0.0 /100 | #338 | Tragic 9.4% |
| Crow | 0.0 /100 | #339 | Tragic 9.6% |
| Yuman | 0.0 /100 | #340 | Tragic 9.7% |
| Pueblo | 0.0 /100 | #341 | Tragic 11.1% |
| Tohono O'odham | 0.0 /100 | #342 | Tragic 11.2% |
| Pima | 0.0 /100 | #343 | Tragic 11.4% |
| Navajo | 0.0 /100 | #344 | Tragic 11.9% |
| Puerto Ricans | 0.0 /100 | #345 | Tragic 12.6% |
| Immigrants | Yemen | 0.0 /100 | #346 | Tragic 12.8% |
| Yup'ik | 0.0 /100 | #347 | Tragic 13.4% |