Immigrants from Hong Kong vs Immigrants from El Salvador Married-Couple Family Poverty
COMPARE
Immigrants from Hong Kong
Immigrants from El Salvador
Married-Couple Family Poverty
Married-Couple Family Poverty Comparison
Immigrants from Hong Kong
Immigrants from El Salvador
4.7%
MARRIED-COUPLE FAMILY POVERTY
96.4/ 100
METRIC RATING
109th/ 347
METRIC RANK
6.8%
MARRIED-COUPLE FAMILY POVERTY
0.0/ 100
METRIC RATING
303rd/ 347
METRIC RANK
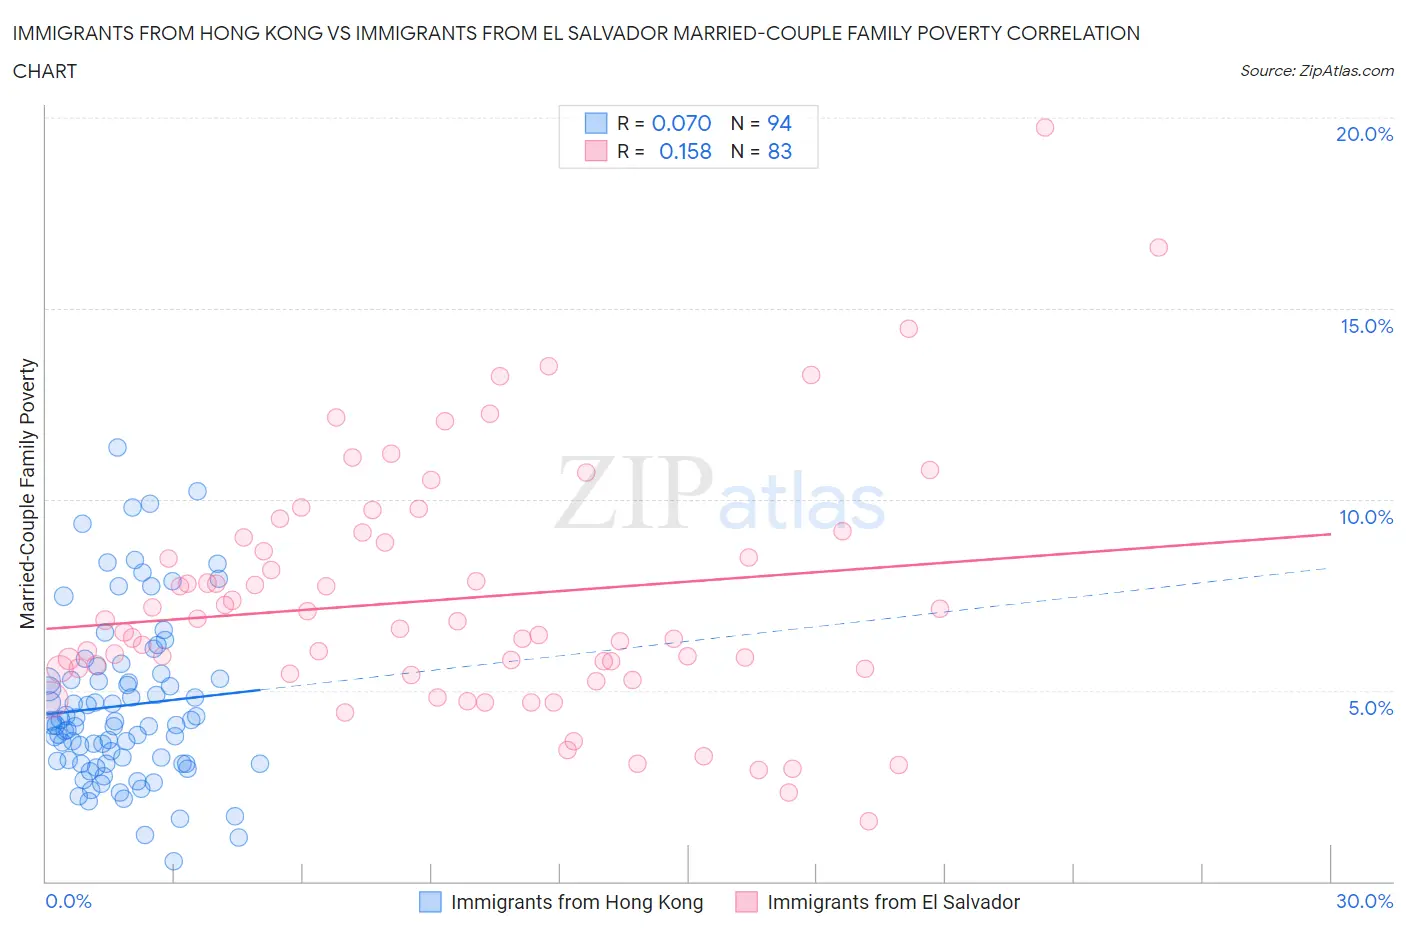
Immigrants from Hong Kong vs Immigrants from El Salvador Married-Couple Family Poverty Correlation Chart
The statistical analysis conducted on geographies consisting of 252,495,550 people shows a slight positive correlation between the proportion of Immigrants from Hong Kong and poverty level among married-couple families in the United States with a correlation coefficient (R) of 0.070 and weighted average of 4.7%. Similarly, the statistical analysis conducted on geographies consisting of 355,612,998 people shows a poor positive correlation between the proportion of Immigrants from El Salvador and poverty level among married-couple families in the United States with a correlation coefficient (R) of 0.158 and weighted average of 6.8%, a difference of 43.3%.
Married-Couple Family Poverty Correlation Summary
| Measurement | Immigrants from Hong Kong | Immigrants from El Salvador |
| Minimum | 0.53% | 1.6% |
| Maximum | 11.4% | 19.7% |
| Range | 10.8% | 18.2% |
| Mean | 4.6% | 7.4% |
| Median | 4.1% | 6.6% |
| Interquartile 25% (IQ1) | 3.1% | 5.6% |
| Interquartile 75% (IQ3) | 5.3% | 9.0% |
| Interquartile Range (IQR) | 2.2% | 3.4% |
| Standard Deviation (Sample) | 2.2% | 3.2% |
| Standard Deviation (Population) | 2.1% | 3.2% |
Similar Demographics by Married-Couple Family Poverty
Demographics Similar to Immigrants from Hong Kong by Married-Couple Family Poverty
In terms of married-couple family poverty, the demographic groups most similar to Immigrants from Hong Kong are Immigrants from Bolivia (4.7%, a difference of 0.16%), Laotian (4.7%, a difference of 0.20%), Pakistani (4.7%, a difference of 0.20%), Tongan (4.7%, a difference of 0.38%), and Immigrants from Nepal (4.7%, a difference of 0.45%).
| Demographics | Rating | Rank | Married-Couple Family Poverty |
| Asians | 97.6 /100 | #102 | Exceptional 4.7% |
| Immigrants | Romania | 97.3 /100 | #103 | Exceptional 4.7% |
| Immigrants | Moldova | 97.1 /100 | #104 | Exceptional 4.7% |
| Aleuts | 97.0 /100 | #105 | Exceptional 4.7% |
| Immigrants | France | 96.9 /100 | #106 | Exceptional 4.7% |
| Immigrants | Germany | 96.8 /100 | #107 | Exceptional 4.7% |
| Laotians | 96.6 /100 | #108 | Exceptional 4.7% |
| Immigrants | Hong Kong | 96.4 /100 | #109 | Exceptional 4.7% |
| Immigrants | Bolivia | 96.2 /100 | #110 | Exceptional 4.7% |
| Pakistanis | 96.2 /100 | #111 | Exceptional 4.7% |
| Tongans | 95.9 /100 | #112 | Exceptional 4.7% |
| Immigrants | Nepal | 95.9 /100 | #113 | Exceptional 4.7% |
| Immigrants | Indonesia | 95.1 /100 | #114 | Exceptional 4.8% |
| Taiwanese | 94.8 /100 | #115 | Exceptional 4.8% |
| Celtics | 94.8 /100 | #116 | Exceptional 4.8% |
Demographics Similar to Immigrants from El Salvador by Married-Couple Family Poverty
In terms of married-couple family poverty, the demographic groups most similar to Immigrants from El Salvador are Immigrants from Ecuador (6.7%, a difference of 0.28%), Central American (6.7%, a difference of 0.42%), Cuban (6.8%, a difference of 0.44%), Haitian (6.8%, a difference of 0.55%), and Immigrants from Belize (6.7%, a difference of 1.0%).
| Demographics | Rating | Rank | Married-Couple Family Poverty |
| U.S. Virgin Islanders | 0.0 /100 | #296 | Tragic 6.6% |
| Kiowa | 0.0 /100 | #297 | Tragic 6.6% |
| Immigrants | Guyana | 0.0 /100 | #298 | Tragic 6.7% |
| Nicaraguans | 0.0 /100 | #299 | Tragic 6.7% |
| Immigrants | Belize | 0.0 /100 | #300 | Tragic 6.7% |
| Central Americans | 0.0 /100 | #301 | Tragic 6.7% |
| Immigrants | Ecuador | 0.0 /100 | #302 | Tragic 6.7% |
| Immigrants | El Salvador | 0.0 /100 | #303 | Tragic 6.8% |
| Cubans | 0.0 /100 | #304 | Tragic 6.8% |
| Haitians | 0.0 /100 | #305 | Tragic 6.8% |
| Immigrants | Haiti | 0.0 /100 | #306 | Tragic 7.0% |
| Guatemalans | 0.0 /100 | #307 | Tragic 7.0% |
| Spanish American Indians | 0.0 /100 | #308 | Tragic 7.1% |
| Hopi | 0.0 /100 | #309 | Tragic 7.1% |
| Immigrants | Nicaragua | 0.0 /100 | #310 | Tragic 7.1% |