Immigrants from Hong Kong vs Immigrants from England Married-Couple Family Poverty

COMPARE

Immigrants from Hong Kong
Race
Ancestry
AfghanAfricanAlaska NativeAlaskan AthabascanAlbanianAleutAlsatianAmericanApacheArabArapahoArgentineanArmenianAssyrian/Chaldean/SyriacAustralianAustrianBahamianBangladeshiBarbadianBasqueBelgianBelizeanBermudanBhutaneseBlackfeetBolivianBrazilianBritishBritish West IndianBulgarianBurmeseCajunCambodianCanadianCape VerdeanCarpatho RusynCelticCentral AmericanCentral American IndianCherokeeCheyenneChickasawChileanChineseChippewaChoctawColombianColvilleComancheCosta RicanCreeCreekCroatianCrowCubanCypriotCzechCzechoslovakianDanishDelawareDominicanDutchDutch West IndianEastern EuropeanEcuadorianEgyptianEnglishEstonianEthiopianEuropeanFijianFilipinoFinnishFrenchFrench American IndianFrench CanadianGermanGerman RussianGhanaianGreekGuamanian/ChamorroGuatemalanGuyaneseHaitianHmongHonduranHopiHoumaHungarianIcelanderIndian (Asian)IndonesianInupiatIranianIraqiIrishIroquoisIsraeliItalianJamaicanJapaneseJordanianKenyanKiowaKoreanLaotianLatvianLebaneseLiberianLithuanianLumbeeLuxembourgerMacedonianMalaysianMalteseMarshalleseMenomineeMexicanMexican American IndianMongolianMoroccanNative HawaiianNavajoNepaleseNew ZealanderNicaraguanNigerianNorthern EuropeanNorwegianOkinawanOsageOttawaPaiutePakistaniPalestinianPanamanianParaguayanPennsylvania GermanPeruvianPimaPolishPortuguesePotawatomiPuebloPuerto RicanPuget Sound SalishRomanianRussianSalvadoranSamoanScandinavianScotch-IrishScottishSeminoleSenegaleseSerbianShoshoneSierra LeoneanSiouxSlavicSlovakSloveneSomaliSouth AfricanSouth AmericanSouth American IndianSoviet UnionSpaniardSpanishSpanish AmericanSpanish American IndianSri LankanSubsaharan AfricanSudaneseSwedishSwissSyrianTaiwaneseThaiTlingit-HaidaTohono O'OdhamTonganTrinidadian and TobagonianTsimshianTurkishU.S. Virgin IslanderUgandanUkrainianUruguayanUteVenezuelanVietnameseWelshWest IndianYakamaYaquiYugoslavianYumanYup'ikZimbabwean
Immigration
NonimmigrantsImmigrantsAfghanistanAfricaAlbaniaArgentinaArmeniaAsiaAustraliaAustriaBahamasBangladeshBarbadosBelarusBelgiumBelizeBoliviaBosnia and HerzegovinaBrazilBulgariaBurma/MyanmarCabo VerdeCambodiaCameroonCanadaCaribbeanCentral AmericaChileChinaColombiaCongoCosta RicaCroatiaCubaCzechoslovakiaDenmarkDominicaDominican RepublicEastern AfricaEastern AsiaEastern EuropeEcuadorEgyptEl SalvadorEritreaEthiopiaEuropeFijiFranceGermanyGhanaGreeceGrenadaGuatemalaGuyanaHaitiHondurasHong KongHungaryIndiaIndonesiaIranIraqIrelandIsraelItalyJamaicaJapanJordanKazakhstanKenyaKoreaKuwaitLaosLatin AmericaLatviaLebanonLiberiaLithuaniaMalaysiaMexicoMicronesiaMiddle AfricaMoldovaMoroccoNepalNetherlandsNicaraguaNigeriaNorth AmericaNorth MacedoniaNorthern AfricaNorthern EuropeNorwayOceaniaPakistanPanamaPeruPhilippinesPolandPortugalRomaniaRussiaSaudi ArabiaScotlandSenegalSerbiaSierra LeoneSingaporeSomaliaSouth AfricaSouth AmericaSouth Central AsiaSouth Eastern AsiaSouthern EuropeSpainSri LankaSt. Vincent and the GrenadinesSudanSwedenSwitzerlandSyriaTaiwanThailandTrinidad and TobagoTurkeyUgandaUkraineUruguayUzbekistanVenezuelaVietnamWest IndiesWestern AfricaWestern AsiaWestern EuropeYemenZaireZimbabweAzores
Immigrants from England
Race
Ancestry
AfghanAfricanAlaska NativeAlaskan AthabascanAlbanianAleutAlsatianAmericanApacheArabArapahoArgentineanArmenianAssyrian/Chaldean/SyriacAustralianAustrianBahamianBangladeshiBarbadianBasqueBelgianBelizeanBermudanBhutaneseBlackfeetBolivianBrazilianBritishBritish West IndianBulgarianBurmeseCajunCambodianCanadianCape VerdeanCarpatho RusynCelticCentral AmericanCentral American IndianCherokeeCheyenneChickasawChileanChineseChippewaChoctawColombianColvilleComancheCosta RicanCreeCreekCroatianCrowCubanCypriotCzechCzechoslovakianDanishDelawareDominicanDutchDutch West IndianEastern EuropeanEcuadorianEgyptianEnglishEstonianEthiopianEuropeanFijianFilipinoFinnishFrenchFrench American IndianFrench CanadianGermanGerman RussianGhanaianGreekGuamanian/ChamorroGuatemalanGuyaneseHaitianHmongHonduranHopiHoumaHungarianIcelanderIndian (Asian)IndonesianInupiatIranianIraqiIrishIroquoisIsraeliItalianJamaicanJapaneseJordanianKenyanKiowaKoreanLaotianLatvianLebaneseLiberianLithuanianLumbeeLuxembourgerMacedonianMalaysianMalteseMarshalleseMenomineeMexicanMexican American IndianMongolianMoroccanNative HawaiianNavajoNepaleseNew ZealanderNicaraguanNigerianNorthern EuropeanNorwegianOkinawanOsageOttawaPaiutePakistaniPalestinianPanamanianParaguayanPennsylvania GermanPeruvianPimaPolishPortuguesePotawatomiPuebloPuerto RicanPuget Sound SalishRomanianRussianSalvadoranSamoanScandinavianScotch-IrishScottishSeminoleSenegaleseSerbianShoshoneSierra LeoneanSiouxSlavicSlovakSloveneSomaliSouth AfricanSouth AmericanSouth American IndianSoviet UnionSpaniardSpanishSpanish AmericanSpanish American IndianSri LankanSubsaharan AfricanSudaneseSwedishSwissSyrianTaiwaneseThaiTlingit-HaidaTohono O'OdhamTonganTrinidadian and TobagonianTsimshianTurkishU.S. Virgin IslanderUgandanUkrainianUruguayanUteVenezuelanVietnameseWelshWest IndianYakamaYaquiYugoslavianYumanYup'ikZimbabwean
Immigration
NonimmigrantsImmigrantsAfghanistanAfricaAlbaniaArgentinaArmeniaAsiaAustraliaAustriaBahamasBangladeshBarbadosBelarusBelgiumBelizeBoliviaBosnia and HerzegovinaBrazilBulgariaBurma/MyanmarCabo VerdeCambodiaCameroonCanadaCaribbeanCentral AmericaChileChinaColombiaCongoCosta RicaCroatiaCubaCzechoslovakiaDenmarkDominicaDominican RepublicEastern AfricaEastern AsiaEastern EuropeEcuadorEgyptEl SalvadorEnglandEritreaEthiopiaEuropeFijiFranceGermanyGhanaGreeceGrenadaGuatemalaGuyanaHaitiHondurasHungaryIndiaIndonesiaIranIraqIrelandIsraelItalyJamaicaJapanJordanKazakhstanKenyaKoreaKuwaitLaosLatin AmericaLatviaLebanonLiberiaLithuaniaMalaysiaMexicoMicronesiaMiddle AfricaMoldovaMoroccoNepalNetherlandsNicaraguaNigeriaNorth AmericaNorth MacedoniaNorthern AfricaNorthern EuropeNorwayOceaniaPakistanPanamaPeruPhilippinesPolandPortugalRomaniaRussiaSaudi ArabiaScotlandSenegalSerbiaSierra LeoneSingaporeSomaliaSouth AfricaSouth AmericaSouth Central AsiaSouth Eastern AsiaSouthern EuropeSpainSri LankaSt. Vincent and the GrenadinesSudanSwedenSwitzerlandSyriaTaiwanThailandTrinidad and TobagoTurkeyUgandaUkraineUruguayUzbekistanVenezuelaVietnamWest IndiesWestern AfricaWestern AsiaWestern EuropeYemenZaireZimbabweAzores
Married-Couple Family Poverty
Income
Poverty
Unemployment
Labor Participation
Family Structure
Vehicle Availability
Education Level
Disability

Married-Couple Family Poverty Comparison

Immigrants from Hong Kong

Immigrants from England

Exceptional
Exceptional
4.7%
MARRIED-COUPLE FAMILY POVERTY
96.4/ 100
METRIC RATING
109th/ 347
METRIC RANK
4.5%
MARRIED-COUPLE FAMILY POVERTY
99.3/ 100
METRIC RATING
72nd/ 347
METRIC RANK

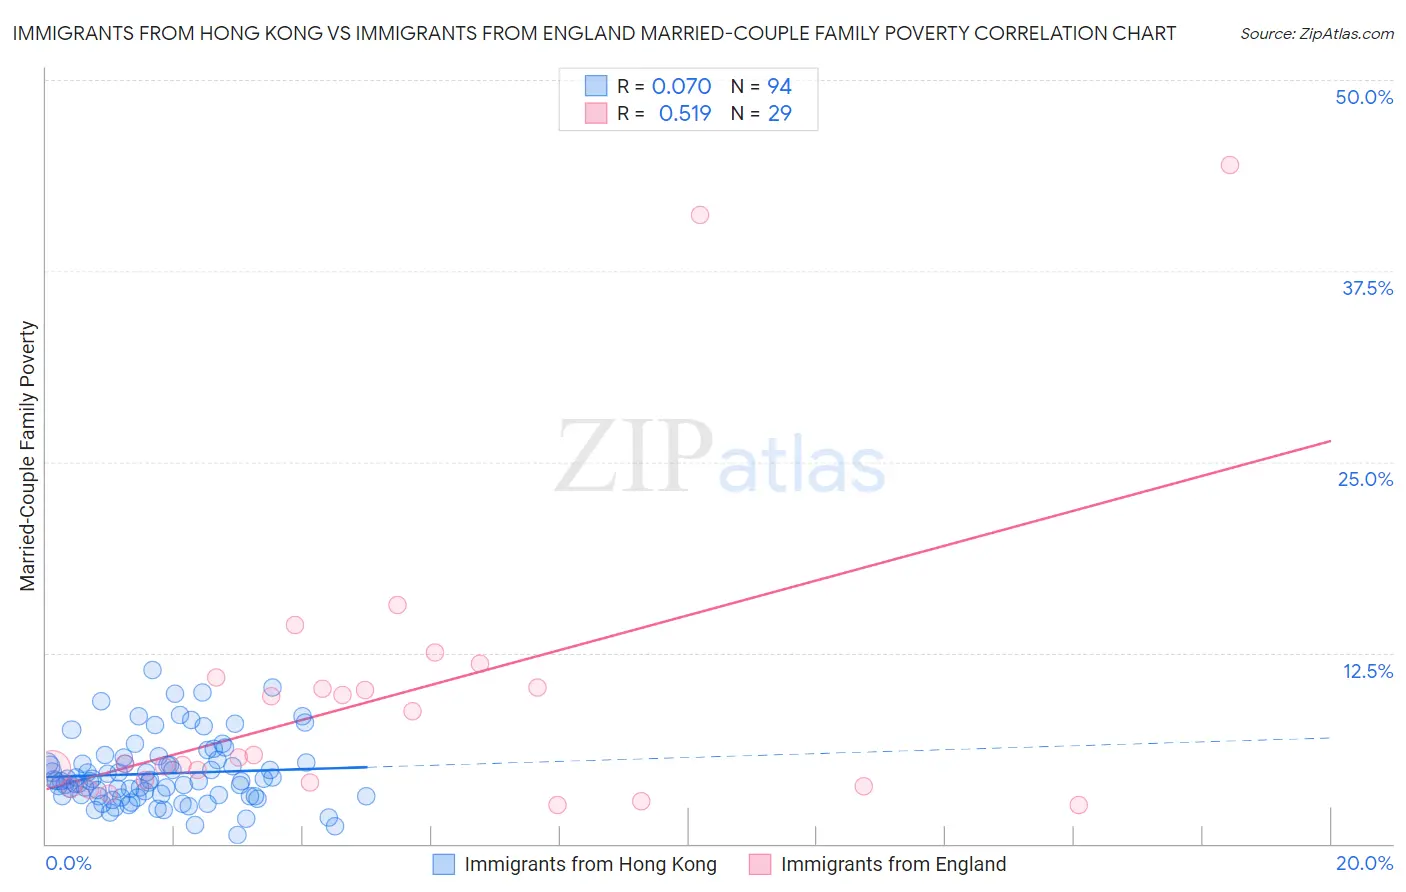
Immigrants from Hong Kong vs Immigrants from England Married-Couple Family Poverty Correlation Chart

The statistical analysis conducted on geographies consisting of 252,495,550 people shows a slight positive correlation between the proportion of Immigrants from Hong Kong and poverty level among married-couple families in the United States with a correlation coefficient (R) of 0.070 and weighted average of 4.7%. Similarly, the statistical analysis conducted on geographies consisting of 387,900,706 people shows a substantial positive correlation between the proportion of Immigrants from England and poverty level among married-couple families in the United States with a correlation coefficient (R) of 0.519 and weighted average of 4.5%, a difference of 5.5%.
Immigrants from Hong Kong vs Immigrants from England Married-Couple Family Poverty

Married-Couple Family Poverty Correlation Summary

MeasurementImmigrants from Hong KongImmigrants from England
Minimum0.53%2.5%
Maximum11.4%44.4%
Range10.8%41.9%
Mean4.6%9.5%
Median4.1%5.6%
Interquartile 25% (IQ1)3.1%3.9%
Interquartile 75% (IQ3)5.3%10.5%
Interquartile Range (IQR)2.2%6.6%
Standard Deviation (Sample)2.2%10.0%
Standard Deviation (Population)2.1%9.8%

Similar Demographics by Married-Couple Family Poverty

Demographics Similar to Immigrants from Hong Kong by Married-Couple Family Poverty

In terms of married-couple family poverty, the demographic groups most similar to Immigrants from Hong Kong are Immigrants from Bolivia (4.7%, a difference of 0.16%), Laotian (4.7%, a difference of 0.20%), Pakistani (4.7%, a difference of 0.20%), Tongan (4.7%, a difference of 0.38%), and Immigrants from Nepal (4.7%, a difference of 0.45%).
DemographicsRating | RankMarried-Couple Family Poverty
Asians
97.6
/100
|
#102
Exceptional
4.7%
Immigrants | Romania
97.3
/100
|
#103
Exceptional
4.7%
Immigrants | Moldova
97.1
/100
|
#104
Exceptional
4.7%
Aleuts
97.0
/100
|
#105
Exceptional
4.7%
Immigrants | France
96.9
/100
|
#106
Exceptional
4.7%
Immigrants | Germany
96.8
/100
|
#107
Exceptional
4.7%
Laotians
96.6
/100
|
#108
Exceptional
4.7%
Immigrants | Hong Kong
96.4
/100
|
#109
Exceptional
4.7%
Immigrants | Bolivia
96.2
/100
|
#110
Exceptional
4.7%
Pakistanis
96.2
/100
|
#111
Exceptional
4.7%
Tongans
95.9
/100
|
#112
Exceptional
4.7%
Immigrants | Nepal
95.9
/100
|
#113
Exceptional
4.7%
Immigrants | Indonesia
95.1
/100
|
#114
Exceptional
4.8%
Taiwanese
94.8
/100
|
#115
Exceptional
4.8%
Celtics
94.8
/100
|
#116
Exceptional
4.8%

Demographics Similar to Immigrants from England by Married-Couple Family Poverty

In terms of married-couple family poverty, the demographic groups most similar to Immigrants from England are Immigrants from North America (4.5%, a difference of 0.090%), Ukrainian (4.5%, a difference of 0.12%), Immigrants from Austria (4.5%, a difference of 0.22%), Cambodian (4.5%, a difference of 0.49%), and Immigrants from Korea (4.5%, a difference of 0.51%).
DemographicsRating | RankMarried-Couple Family Poverty
Macedonians
99.4
/100
|
#65
Exceptional
4.4%
Immigrants | Serbia
99.4
/100
|
#66
Exceptional
4.4%
Immigrants | Canada
99.4
/100
|
#67
Exceptional
4.4%
Slavs
99.4
/100
|
#68
Exceptional
4.4%
New Zealanders
99.4
/100
|
#69
Exceptional
4.4%
Immigrants | Korea
99.4
/100
|
#70
Exceptional
4.5%
Immigrants | North America
99.3
/100
|
#71
Exceptional
4.5%
Immigrants | England
99.3
/100
|
#72
Exceptional
4.5%
Ukrainians
99.2
/100
|
#73
Exceptional
4.5%
Immigrants | Austria
99.2
/100
|
#74
Exceptional
4.5%
Cambodians
99.2
/100
|
#75
Exceptional
4.5%
Immigrants | South Africa
99.1
/100
|
#76
Exceptional
4.5%
Immigrants | Latvia
99.1
/100
|
#77
Exceptional
4.5%
Scotch-Irish
99.1
/100
|
#78
Exceptional
4.5%
Immigrants | Iran
99.0
/100
|
#79
Exceptional
4.5%