Danish vs Menominee Poverty
COMPARE
Danish
Menominee
Poverty
Poverty Comparison
Danes
Menominee
10.7%
POVERTY
99.5/ 100
METRIC RATING
30th/ 347
METRIC RANK
16.4%
POVERTY
0.0/ 100
METRIC RATING
322nd/ 347
METRIC RANK
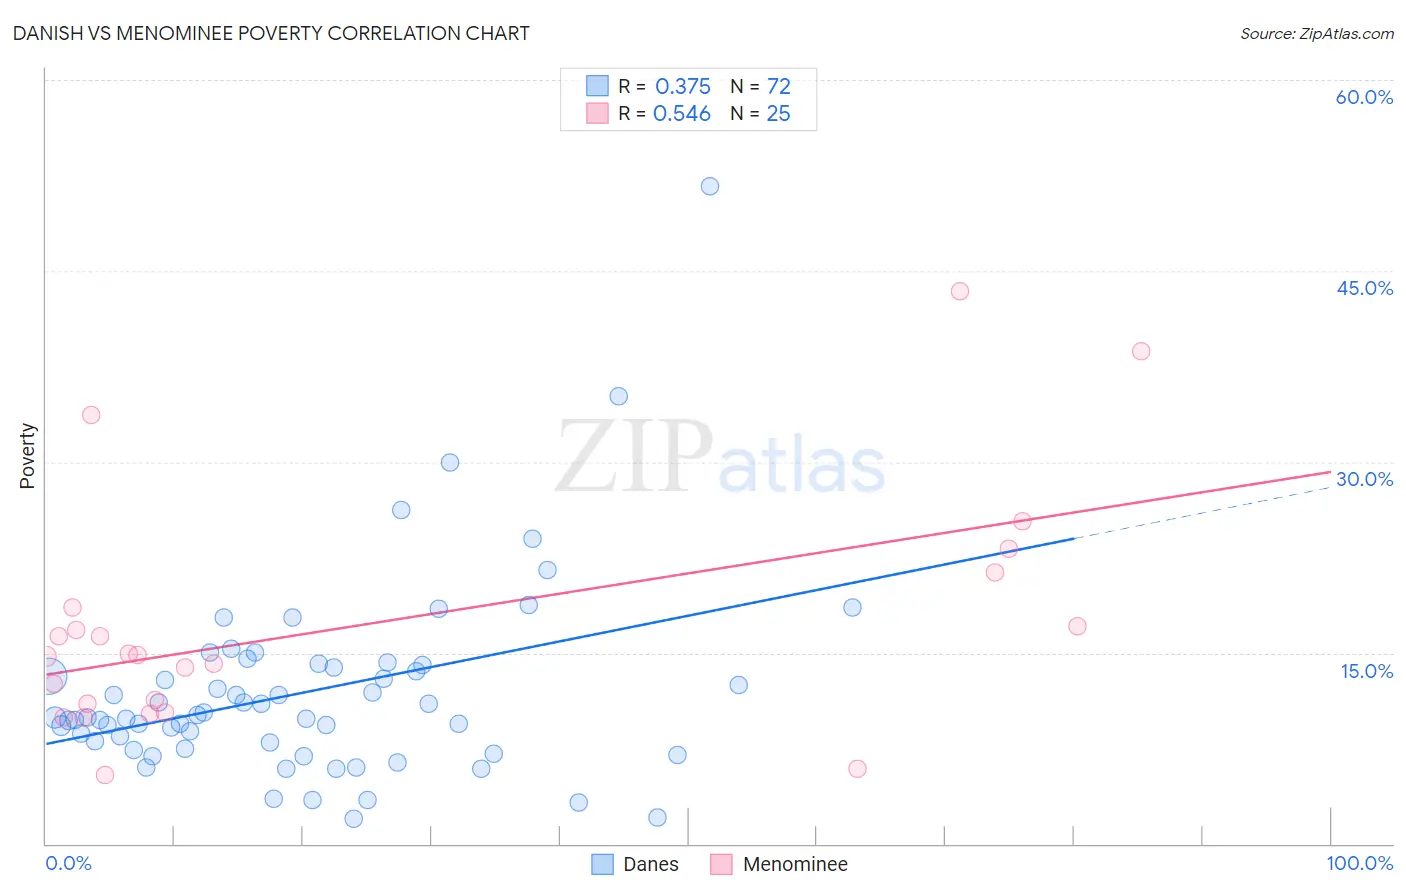
Danish vs Menominee Poverty Correlation Chart
The statistical analysis conducted on geographies consisting of 473,839,079 people shows a mild positive correlation between the proportion of Danes and poverty level in the United States with a correlation coefficient (R) of 0.375 and weighted average of 10.7%. Similarly, the statistical analysis conducted on geographies consisting of 45,777,730 people shows a substantial positive correlation between the proportion of Menominee and poverty level in the United States with a correlation coefficient (R) of 0.546 and weighted average of 16.4%, a difference of 53.3%.
Poverty Correlation Summary
| Measurement | Danish | Menominee |
| Minimum | 1.9% | 5.4% |
| Maximum | 51.6% | 43.5% |
| Range | 49.7% | 38.1% |
| Mean | 11.9% | 17.2% |
| Median | 10.0% | 14.8% |
| Interquartile 25% (IQ1) | 7.7% | 10.7% |
| Interquartile 75% (IQ3) | 13.9% | 19.9% |
| Interquartile Range (IQR) | 6.2% | 9.2% |
| Standard Deviation (Sample) | 7.6% | 9.5% |
| Standard Deviation (Population) | 7.6% | 9.3% |
Similar Demographics by Poverty
Demographics Similar to Danes by Poverty
In terms of poverty, the demographic groups most similar to Danes are Greek (10.7%, a difference of 0.010%), Polish (10.7%, a difference of 0.080%), Immigrants from Korea (10.7%, a difference of 0.10%), Immigrants from Northern Europe (10.7%, a difference of 0.17%), and Iranian (10.7%, a difference of 0.17%).
| Demographics | Rating | Rank | Poverty |
| Swedes | 99.7 /100 | #23 | Exceptional 10.6% |
| Italians | 99.7 /100 | #24 | Exceptional 10.6% |
| Croatians | 99.6 /100 | #25 | Exceptional 10.6% |
| Burmese | 99.6 /100 | #26 | Exceptional 10.7% |
| Immigrants | Northern Europe | 99.6 /100 | #27 | Exceptional 10.7% |
| Immigrants | Korea | 99.5 /100 | #28 | Exceptional 10.7% |
| Greeks | 99.5 /100 | #29 | Exceptional 10.7% |
| Danes | 99.5 /100 | #30 | Exceptional 10.7% |
| Poles | 99.5 /100 | #31 | Exceptional 10.7% |
| Iranians | 99.5 /100 | #32 | Exceptional 10.7% |
| Macedonians | 99.4 /100 | #33 | Exceptional 10.8% |
| Immigrants | Poland | 99.4 /100 | #34 | Exceptional 10.8% |
| Tongans | 99.4 /100 | #35 | Exceptional 10.8% |
| Cypriots | 99.3 /100 | #36 | Exceptional 10.8% |
| Immigrants | Greece | 99.3 /100 | #37 | Exceptional 10.8% |
Demographics Similar to Menominee by Poverty
In terms of poverty, the demographic groups most similar to Menominee are Colville (16.6%, a difference of 0.75%), Arapaho (16.3%, a difference of 0.96%), Yakama (16.7%, a difference of 1.3%), Central American Indian (16.7%, a difference of 1.5%), and Immigrants from Honduras (16.2%, a difference of 1.7%).
| Demographics | Rating | Rank | Poverty |
| British West Indians | 0.0 /100 | #315 | Tragic 15.9% |
| Hondurans | 0.0 /100 | #316 | Tragic 15.9% |
| U.S. Virgin Islanders | 0.0 /100 | #317 | Tragic 16.1% |
| Immigrants | Dominica | 0.0 /100 | #318 | Tragic 16.1% |
| Immigrants | Congo | 0.0 /100 | #319 | Tragic 16.1% |
| Immigrants | Honduras | 0.0 /100 | #320 | Tragic 16.2% |
| Arapaho | 0.0 /100 | #321 | Tragic 16.3% |
| Menominee | 0.0 /100 | #322 | Tragic 16.4% |
| Colville | 0.0 /100 | #323 | Tragic 16.6% |
| Yakama | 0.0 /100 | #324 | Tragic 16.7% |
| Central American Indians | 0.0 /100 | #325 | Tragic 16.7% |
| Paiute | 0.0 /100 | #326 | Tragic 16.7% |
| Kiowa | 0.0 /100 | #327 | Tragic 16.8% |
| Ute | 0.0 /100 | #328 | Tragic 16.9% |
| Blacks/African Americans | 0.0 /100 | #329 | Tragic 17.3% |