Immigrants from Caribbean vs Menominee Doctorate Degree
COMPARE
Immigrants from Caribbean
Menominee
Doctorate Degree
Doctorate Degree Comparison
Immigrants from Caribbean
Menominee
1.3%
DOCTORATE DEGREE
0.0/ 100
METRIC RATING
333rd/ 347
METRIC RANK
1.4%
DOCTORATE DEGREE
0.1/ 100
METRIC RATING
313th/ 347
METRIC RANK
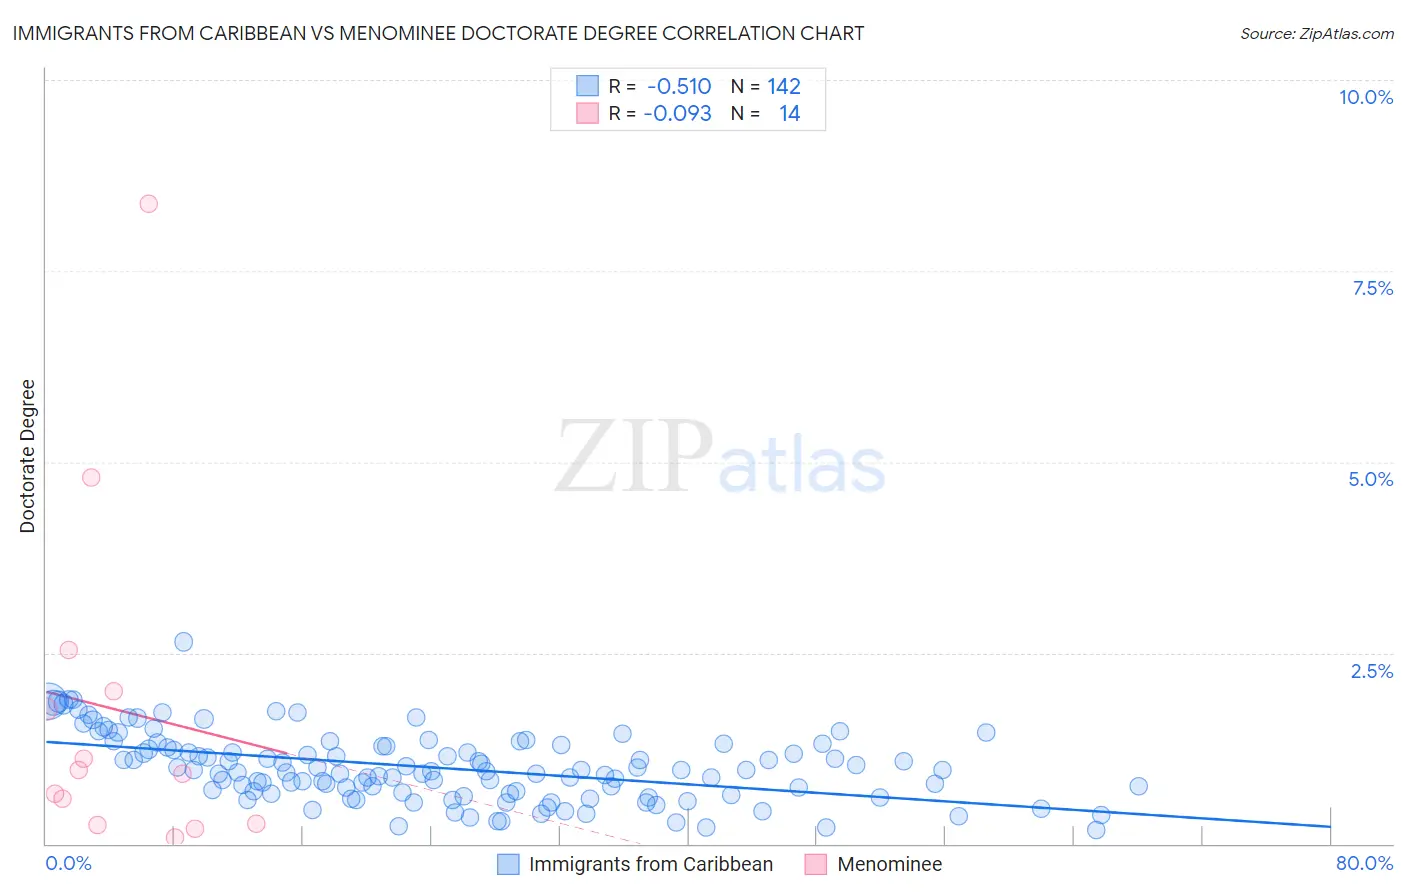
Immigrants from Caribbean vs Menominee Doctorate Degree Correlation Chart
The statistical analysis conducted on geographies consisting of 443,887,060 people shows a substantial negative correlation between the proportion of Immigrants from Caribbean and percentage of population with at least doctorate degree education in the United States with a correlation coefficient (R) of -0.510 and weighted average of 1.3%. Similarly, the statistical analysis conducted on geographies consisting of 45,550,616 people shows a slight negative correlation between the proportion of Menominee and percentage of population with at least doctorate degree education in the United States with a correlation coefficient (R) of -0.093 and weighted average of 1.4%, a difference of 5.7%.
Doctorate Degree Correlation Summary
| Measurement | Immigrants from Caribbean | Menominee |
| Minimum | 0.18% | 0.087% |
| Maximum | 2.6% | 8.4% |
| Range | 2.5% | 8.3% |
| Mean | 1.00% | 1.8% |
| Median | 0.96% | 0.94% |
| Interquartile 25% (IQ1) | 0.67% | 0.26% |
| Interquartile 75% (IQ3) | 1.3% | 2.0% |
| Interquartile Range (IQR) | 0.61% | 1.7% |
| Standard Deviation (Sample) | 0.44% | 2.3% |
| Standard Deviation (Population) | 0.44% | 2.2% |
Demographics Similar to Immigrants from Caribbean and Menominee by Doctorate Degree
In terms of doctorate degree, the demographic groups most similar to Immigrants from Caribbean are Yakama (1.3%, a difference of 0.16%), Immigrants from Latin America (1.3%, a difference of 1.7%), Yup'ik (1.3%, a difference of 1.8%), Haitian (1.3%, a difference of 2.0%), and Inupiat (1.3%, a difference of 2.0%). Similarly, the demographic groups most similar to Menominee are Dominican (1.4%, a difference of 0.080%), Immigrants from the Azores (1.4%, a difference of 0.10%), Navajo (1.4%, a difference of 0.31%), Immigrants from Micronesia (1.3%, a difference of 0.55%), and Creek (1.3%, a difference of 0.61%).
| Demographics | Rating | Rank | Doctorate Degree |
| Menominee | 0.1 /100 | #313 | Tragic 1.4% |
| Dominicans | 0.1 /100 | #314 | Tragic 1.4% |
| Immigrants | Azores | 0.1 /100 | #315 | Tragic 1.4% |
| Navajo | 0.1 /100 | #316 | Tragic 1.4% |
| Immigrants | Micronesia | 0.1 /100 | #317 | Tragic 1.3% |
| Creek | 0.1 /100 | #318 | Tragic 1.3% |
| Immigrants | Guyana | 0.1 /100 | #319 | Tragic 1.3% |
| Immigrants | St. Vincent and the Grenadines | 0.1 /100 | #320 | Tragic 1.3% |
| Dutch West Indians | 0.1 /100 | #321 | Tragic 1.3% |
| Seminole | 0.1 /100 | #322 | Tragic 1.3% |
| Immigrants | Belize | 0.1 /100 | #323 | Tragic 1.3% |
| Natives/Alaskans | 0.0 /100 | #324 | Tragic 1.3% |
| Pima | 0.0 /100 | #325 | Tragic 1.3% |
| Immigrants | Cabo Verde | 0.0 /100 | #326 | Tragic 1.3% |
| Hispanics or Latinos | 0.0 /100 | #327 | Tragic 1.3% |
| Inupiat | 0.0 /100 | #328 | Tragic 1.3% |
| Haitians | 0.0 /100 | #329 | Tragic 1.3% |
| Yup'ik | 0.0 /100 | #330 | Tragic 1.3% |
| Immigrants | Latin America | 0.0 /100 | #331 | Tragic 1.3% |
| Yakama | 0.0 /100 | #332 | Tragic 1.3% |
| Immigrants | Caribbean | 0.0 /100 | #333 | Tragic 1.3% |