Peruvian vs Menominee Poverty
COMPARE
Peruvian
Menominee
Poverty
Poverty Comparison
Peruvians
Menominee
11.8%
POVERTY
85.6/ 100
METRIC RATING
132nd/ 347
METRIC RANK
16.4%
POVERTY
0.0/ 100
METRIC RATING
322nd/ 347
METRIC RANK
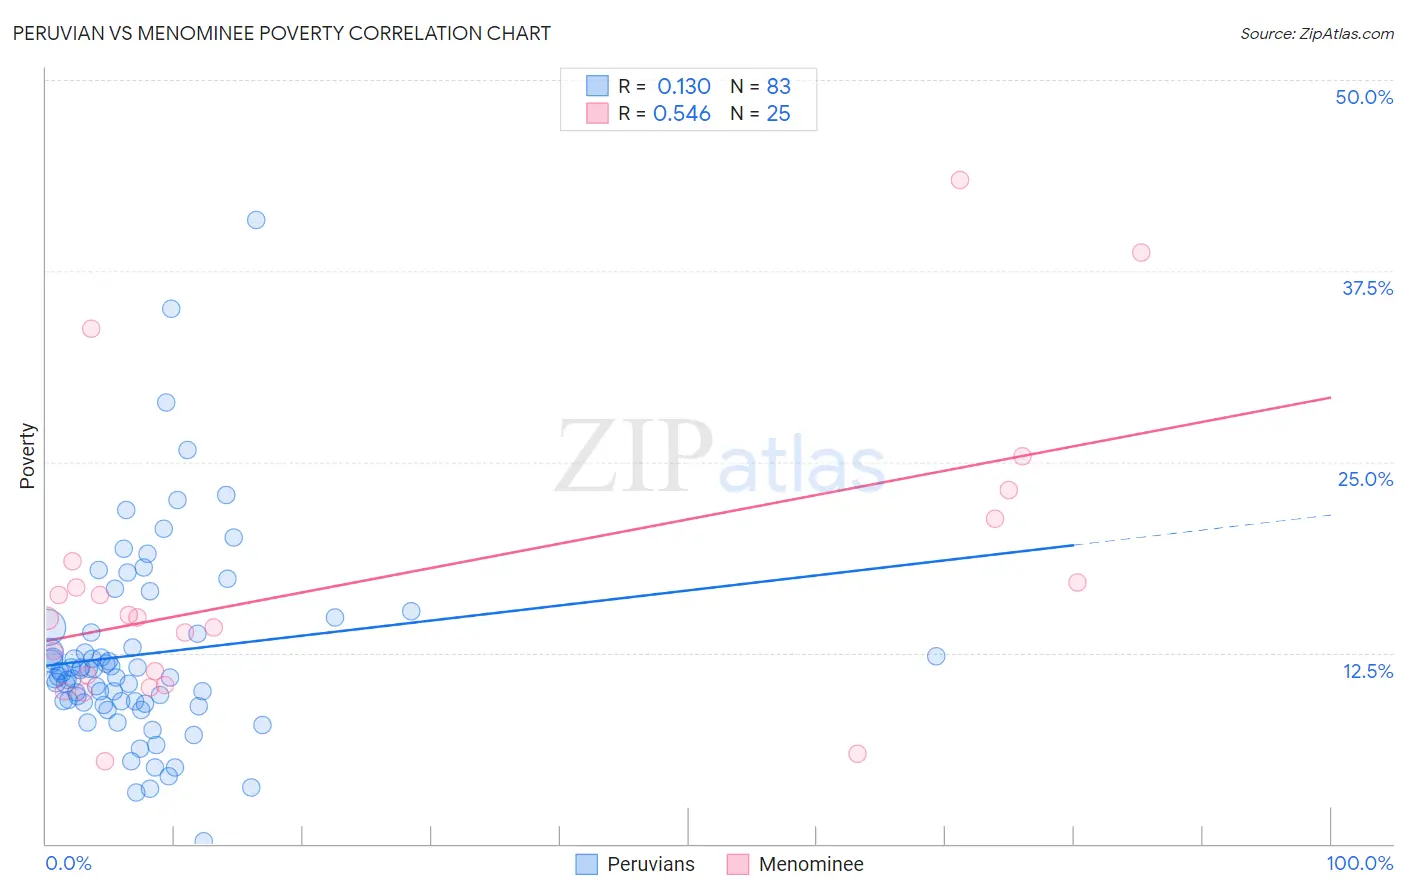
Peruvian vs Menominee Poverty Correlation Chart
The statistical analysis conducted on geographies consisting of 363,001,635 people shows a poor positive correlation between the proportion of Peruvians and poverty level in the United States with a correlation coefficient (R) of 0.130 and weighted average of 11.8%. Similarly, the statistical analysis conducted on geographies consisting of 45,777,730 people shows a substantial positive correlation between the proportion of Menominee and poverty level in the United States with a correlation coefficient (R) of 0.546 and weighted average of 16.4%, a difference of 39.5%.
Poverty Correlation Summary
| Measurement | Peruvian | Menominee |
| Minimum | 0.14% | 5.4% |
| Maximum | 40.8% | 43.5% |
| Range | 40.7% | 38.1% |
| Mean | 12.4% | 17.2% |
| Median | 11.2% | 14.8% |
| Interquartile 25% (IQ1) | 9.2% | 10.7% |
| Interquartile 75% (IQ3) | 13.8% | 19.9% |
| Interquartile Range (IQR) | 4.6% | 9.2% |
| Standard Deviation (Sample) | 6.5% | 9.5% |
| Standard Deviation (Population) | 6.4% | 9.3% |
Similar Demographics by Poverty
Demographics Similar to Peruvians by Poverty
In terms of poverty, the demographic groups most similar to Peruvians are Immigrants from Western Europe (11.8%, a difference of 0.070%), Yugoslavian (11.8%, a difference of 0.080%), Immigrants from Vietnam (11.8%, a difference of 0.090%), French (11.8%, a difference of 0.11%), and Immigrants from Ukraine (11.8%, a difference of 0.21%).
| Demographics | Rating | Rank | Poverty |
| Immigrants | Brazil | 88.2 /100 | #125 | Excellent 11.7% |
| Immigrants | Norway | 88.0 /100 | #126 | Excellent 11.7% |
| Immigrants | Argentina | 88.0 /100 | #127 | Excellent 11.7% |
| Immigrants | Israel | 87.4 /100 | #128 | Excellent 11.7% |
| South Africans | 87.0 /100 | #129 | Excellent 11.7% |
| Immigrants | Ukraine | 86.6 /100 | #130 | Excellent 11.8% |
| French | 86.1 /100 | #131 | Excellent 11.8% |
| Peruvians | 85.6 /100 | #132 | Excellent 11.8% |
| Immigrants | Western Europe | 85.2 /100 | #133 | Excellent 11.8% |
| Yugoslavians | 85.2 /100 | #134 | Excellent 11.8% |
| Immigrants | Vietnam | 85.2 /100 | #135 | Excellent 11.8% |
| Chileans | 84.2 /100 | #136 | Excellent 11.8% |
| Immigrants | Switzerland | 83.0 /100 | #137 | Excellent 11.8% |
| Immigrants | Jordan | 82.4 /100 | #138 | Excellent 11.9% |
| Pakistanis | 82.2 /100 | #139 | Excellent 11.9% |
Demographics Similar to Menominee by Poverty
In terms of poverty, the demographic groups most similar to Menominee are Colville (16.6%, a difference of 0.75%), Arapaho (16.3%, a difference of 0.96%), Yakama (16.7%, a difference of 1.3%), Central American Indian (16.7%, a difference of 1.5%), and Immigrants from Honduras (16.2%, a difference of 1.7%).
| Demographics | Rating | Rank | Poverty |
| British West Indians | 0.0 /100 | #315 | Tragic 15.9% |
| Hondurans | 0.0 /100 | #316 | Tragic 15.9% |
| U.S. Virgin Islanders | 0.0 /100 | #317 | Tragic 16.1% |
| Immigrants | Dominica | 0.0 /100 | #318 | Tragic 16.1% |
| Immigrants | Congo | 0.0 /100 | #319 | Tragic 16.1% |
| Immigrants | Honduras | 0.0 /100 | #320 | Tragic 16.2% |
| Arapaho | 0.0 /100 | #321 | Tragic 16.3% |
| Menominee | 0.0 /100 | #322 | Tragic 16.4% |
| Colville | 0.0 /100 | #323 | Tragic 16.6% |
| Yakama | 0.0 /100 | #324 | Tragic 16.7% |
| Central American Indians | 0.0 /100 | #325 | Tragic 16.7% |
| Paiute | 0.0 /100 | #326 | Tragic 16.7% |
| Kiowa | 0.0 /100 | #327 | Tragic 16.8% |
| Ute | 0.0 /100 | #328 | Tragic 16.9% |
| Blacks/African Americans | 0.0 /100 | #329 | Tragic 17.3% |