Immigrants from Croatia vs Immigrants from Kenya Poverty
COMPARE
Immigrants from Croatia
Immigrants from Kenya
Poverty
Poverty Comparison
Immigrants from Croatia
Immigrants from Kenya
11.0%
POVERTY
98.7/ 100
METRIC RATING
51st/ 347
METRIC RANK
12.8%
POVERTY
17.5/ 100
METRIC RATING
199th/ 347
METRIC RANK
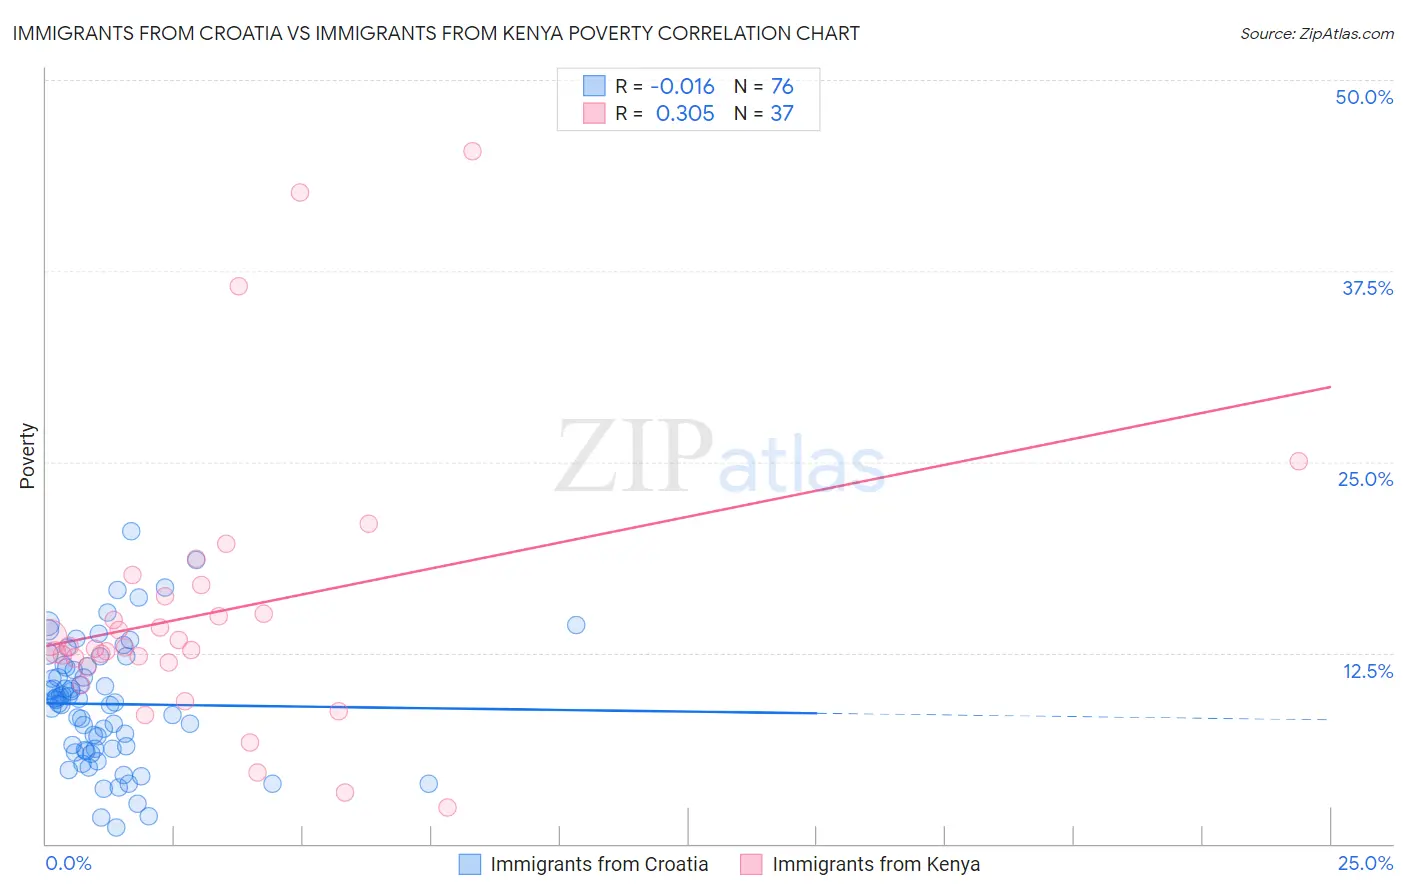
Immigrants from Croatia vs Immigrants from Kenya Poverty Correlation Chart
The statistical analysis conducted on geographies consisting of 132,563,903 people shows no correlation between the proportion of Immigrants from Croatia and poverty level in the United States with a correlation coefficient (R) of -0.016 and weighted average of 11.0%. Similarly, the statistical analysis conducted on geographies consisting of 217,998,097 people shows a mild positive correlation between the proportion of Immigrants from Kenya and poverty level in the United States with a correlation coefficient (R) of 0.305 and weighted average of 12.8%, a difference of 15.9%.
Poverty Correlation Summary
| Measurement | Immigrants from Croatia | Immigrants from Kenya |
| Minimum | 1.1% | 2.4% |
| Maximum | 20.5% | 45.4% |
| Range | 19.4% | 43.0% |
| Mean | 9.1% | 15.2% |
| Median | 9.4% | 12.9% |
| Interquartile 25% (IQ1) | 6.2% | 11.7% |
| Interquartile 75% (IQ3) | 11.6% | 16.6% |
| Interquartile Range (IQR) | 5.4% | 4.8% |
| Standard Deviation (Sample) | 4.0% | 9.2% |
| Standard Deviation (Population) | 4.0% | 9.0% |
Similar Demographics by Poverty
Demographics Similar to Immigrants from Croatia by Poverty
In terms of poverty, the demographic groups most similar to Immigrants from Croatia are Immigrants from Philippines (11.0%, a difference of 0.020%), Immigrants from Austria (11.1%, a difference of 0.24%), Immigrants from Bulgaria (11.1%, a difference of 0.36%), Immigrants from Serbia (11.1%, a difference of 0.39%), and Asian (11.0%, a difference of 0.41%).
| Demographics | Rating | Rank | Poverty |
| Immigrants | Moldova | 99.1 /100 | #44 | Exceptional 10.9% |
| Turks | 98.9 /100 | #45 | Exceptional 11.0% |
| Immigrants | Czechoslovakia | 98.9 /100 | #46 | Exceptional 11.0% |
| Immigrants | Romania | 98.9 /100 | #47 | Exceptional 11.0% |
| Slovenes | 98.9 /100 | #48 | Exceptional 11.0% |
| Immigrants | Japan | 98.9 /100 | #49 | Exceptional 11.0% |
| Asians | 98.9 /100 | #50 | Exceptional 11.0% |
| Immigrants | Croatia | 98.7 /100 | #51 | Exceptional 11.0% |
| Immigrants | Philippines | 98.7 /100 | #52 | Exceptional 11.0% |
| Immigrants | Austria | 98.6 /100 | #53 | Exceptional 11.1% |
| Immigrants | Bulgaria | 98.5 /100 | #54 | Exceptional 11.1% |
| Immigrants | Serbia | 98.5 /100 | #55 | Exceptional 11.1% |
| Estonians | 98.2 /100 | #56 | Exceptional 11.1% |
| Scandinavians | 98.2 /100 | #57 | Exceptional 11.1% |
| Germans | 98.1 /100 | #58 | Exceptional 11.1% |
Demographics Similar to Immigrants from Kenya by Poverty
In terms of poverty, the demographic groups most similar to Immigrants from Kenya are Spaniard (12.8%, a difference of 0.16%), Immigrants from Uganda (12.8%, a difference of 0.16%), Spanish (12.8%, a difference of 0.19%), Immigrants from Lebanon (12.8%, a difference of 0.20%), and Immigrants from Uruguay (12.8%, a difference of 0.32%).
| Demographics | Rating | Rank | Poverty |
| South American Indians | 23.3 /100 | #192 | Fair 12.7% |
| Delaware | 21.4 /100 | #193 | Fair 12.7% |
| Arabs | 21.1 /100 | #194 | Fair 12.7% |
| Immigrants | Kuwait | 20.9 /100 | #195 | Fair 12.7% |
| Iraqis | 20.8 /100 | #196 | Fair 12.7% |
| Immigrants | Lebanon | 18.7 /100 | #197 | Poor 12.8% |
| Spanish | 18.7 /100 | #198 | Poor 12.8% |
| Immigrants | Kenya | 17.5 /100 | #199 | Poor 12.8% |
| Spaniards | 16.5 /100 | #200 | Poor 12.8% |
| Immigrants | Uganda | 16.5 /100 | #201 | Poor 12.8% |
| Immigrants | Uruguay | 15.6 /100 | #202 | Poor 12.8% |
| Hmong | 15.0 /100 | #203 | Poor 12.8% |
| Immigrants | Western Asia | 14.1 /100 | #204 | Poor 12.9% |
| Tsimshian | 9.2 /100 | #205 | Tragic 13.0% |
| Immigrants | Eastern Africa | 7.0 /100 | #206 | Tragic 13.1% |