Immigrants from Southern Europe vs Immigrants from Kenya Poverty
COMPARE
Immigrants from Southern Europe
Immigrants from Kenya
Poverty
Poverty Comparison
Immigrants from Southern Europe
Immigrants from Kenya
11.6%
POVERTY
90.8/ 100
METRIC RATING
112th/ 347
METRIC RANK
12.8%
POVERTY
17.5/ 100
METRIC RATING
199th/ 347
METRIC RANK
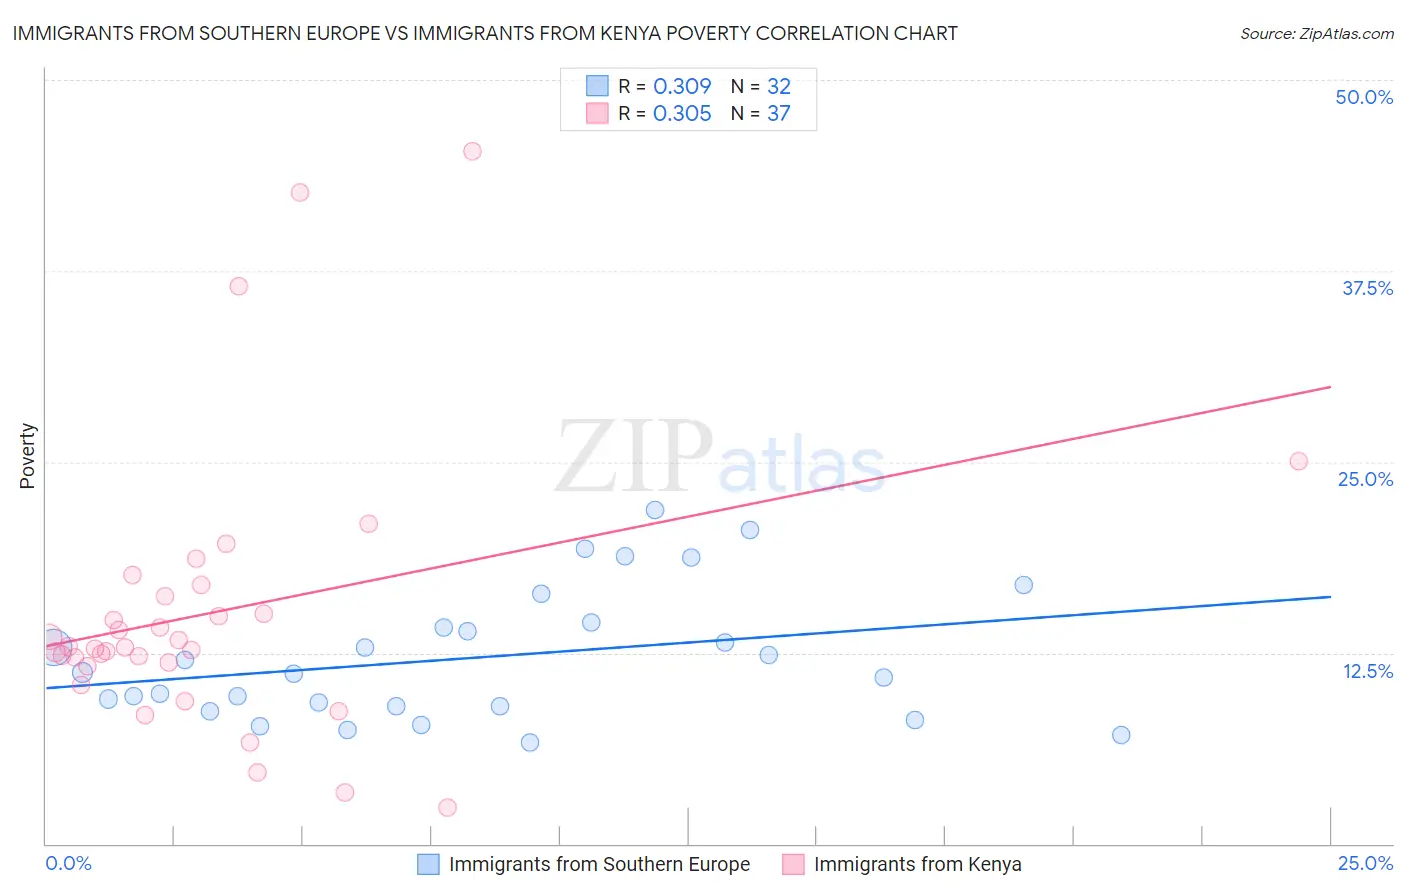
Immigrants from Southern Europe vs Immigrants from Kenya Poverty Correlation Chart
The statistical analysis conducted on geographies consisting of 402,613,085 people shows a mild positive correlation between the proportion of Immigrants from Southern Europe and poverty level in the United States with a correlation coefficient (R) of 0.309 and weighted average of 11.6%. Similarly, the statistical analysis conducted on geographies consisting of 217,998,097 people shows a mild positive correlation between the proportion of Immigrants from Kenya and poverty level in the United States with a correlation coefficient (R) of 0.305 and weighted average of 12.8%, a difference of 9.9%.
Poverty Correlation Summary
| Measurement | Immigrants from Southern Europe | Immigrants from Kenya |
| Minimum | 6.6% | 2.4% |
| Maximum | 21.8% | 45.4% |
| Range | 15.2% | 43.0% |
| Mean | 12.2% | 15.2% |
| Median | 11.2% | 12.9% |
| Interquartile 25% (IQ1) | 9.0% | 11.7% |
| Interquartile 75% (IQ3) | 14.3% | 16.6% |
| Interquartile Range (IQR) | 5.3% | 4.8% |
| Standard Deviation (Sample) | 4.3% | 9.2% |
| Standard Deviation (Population) | 4.2% | 9.0% |
Similar Demographics by Poverty
Demographics Similar to Immigrants from Southern Europe by Poverty
In terms of poverty, the demographic groups most similar to Immigrants from Southern Europe are Immigrants from Belarus (11.6%, a difference of 0.0%), Immigrants from China (11.6%, a difference of 0.020%), French Canadian (11.6%, a difference of 0.070%), Albanian (11.7%, a difference of 0.16%), and Welsh (11.6%, a difference of 0.23%).
| Demographics | Rating | Rank | Poverty |
| Portuguese | 92.1 /100 | #105 | Exceptional 11.6% |
| Immigrants | Zimbabwe | 92.1 /100 | #106 | Exceptional 11.6% |
| Palestinians | 91.8 /100 | #107 | Exceptional 11.6% |
| Canadians | 91.7 /100 | #108 | Exceptional 11.6% |
| Immigrants | Turkey | 91.7 /100 | #109 | Exceptional 11.6% |
| Welsh | 91.6 /100 | #110 | Exceptional 11.6% |
| French Canadians | 91.0 /100 | #111 | Exceptional 11.6% |
| Immigrants | Southern Europe | 90.8 /100 | #112 | Exceptional 11.6% |
| Immigrants | Belarus | 90.8 /100 | #113 | Exceptional 11.6% |
| Immigrants | China | 90.7 /100 | #114 | Exceptional 11.6% |
| Albanians | 90.3 /100 | #115 | Exceptional 11.7% |
| Immigrants | Russia | 89.7 /100 | #116 | Excellent 11.7% |
| Sri Lankans | 89.4 /100 | #117 | Excellent 11.7% |
| Argentineans | 89.1 /100 | #118 | Excellent 11.7% |
| Tlingit-Haida | 89.0 /100 | #119 | Excellent 11.7% |
Demographics Similar to Immigrants from Kenya by Poverty
In terms of poverty, the demographic groups most similar to Immigrants from Kenya are Spaniard (12.8%, a difference of 0.16%), Immigrants from Uganda (12.8%, a difference of 0.16%), Spanish (12.8%, a difference of 0.19%), Immigrants from Lebanon (12.8%, a difference of 0.20%), and Immigrants from Uruguay (12.8%, a difference of 0.32%).
| Demographics | Rating | Rank | Poverty |
| South American Indians | 23.3 /100 | #192 | Fair 12.7% |
| Delaware | 21.4 /100 | #193 | Fair 12.7% |
| Arabs | 21.1 /100 | #194 | Fair 12.7% |
| Immigrants | Kuwait | 20.9 /100 | #195 | Fair 12.7% |
| Iraqis | 20.8 /100 | #196 | Fair 12.7% |
| Immigrants | Lebanon | 18.7 /100 | #197 | Poor 12.8% |
| Spanish | 18.7 /100 | #198 | Poor 12.8% |
| Immigrants | Kenya | 17.5 /100 | #199 | Poor 12.8% |
| Spaniards | 16.5 /100 | #200 | Poor 12.8% |
| Immigrants | Uganda | 16.5 /100 | #201 | Poor 12.8% |
| Immigrants | Uruguay | 15.6 /100 | #202 | Poor 12.8% |
| Hmong | 15.0 /100 | #203 | Poor 12.8% |
| Immigrants | Western Asia | 14.1 /100 | #204 | Poor 12.9% |
| Tsimshian | 9.2 /100 | #205 | Tragic 13.0% |
| Immigrants | Eastern Africa | 7.0 /100 | #206 | Tragic 13.1% |