Ecuadorian vs Immigrants from Kenya Poverty
COMPARE
Ecuadorian
Immigrants from Kenya
Poverty
Poverty Comparison
Ecuadorians
Immigrants from Kenya
14.0%
POVERTY
0.4/ 100
METRIC RATING
242nd/ 347
METRIC RANK
12.8%
POVERTY
17.5/ 100
METRIC RATING
199th/ 347
METRIC RANK
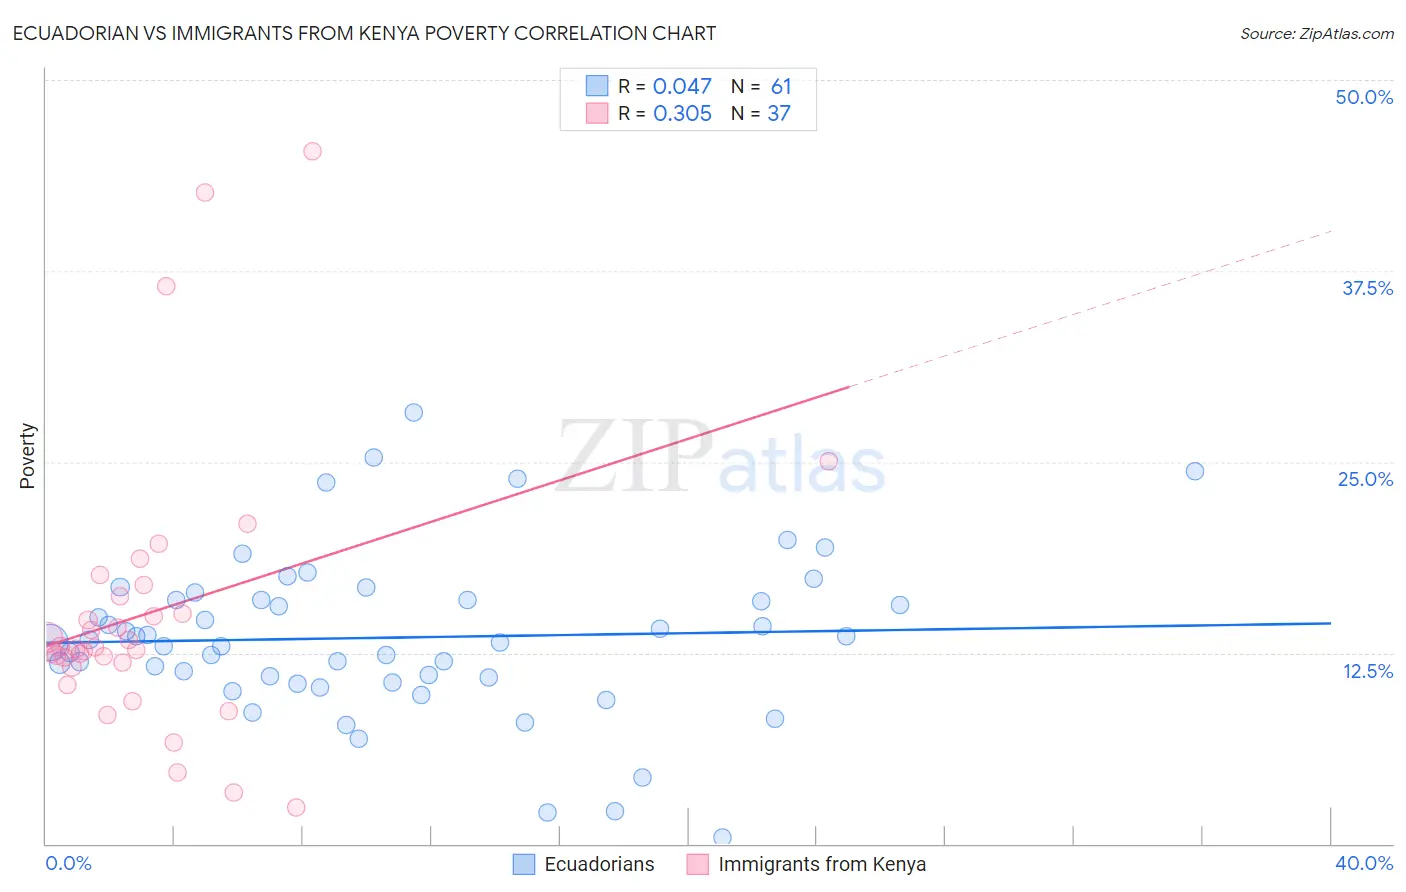
Ecuadorian vs Immigrants from Kenya Poverty Correlation Chart
The statistical analysis conducted on geographies consisting of 317,659,954 people shows no correlation between the proportion of Ecuadorians and poverty level in the United States with a correlation coefficient (R) of 0.047 and weighted average of 14.0%. Similarly, the statistical analysis conducted on geographies consisting of 217,998,097 people shows a mild positive correlation between the proportion of Immigrants from Kenya and poverty level in the United States with a correlation coefficient (R) of 0.305 and weighted average of 12.8%, a difference of 9.6%.
Poverty Correlation Summary
| Measurement | Ecuadorian | Immigrants from Kenya |
| Minimum | 0.41% | 2.4% |
| Maximum | 28.2% | 45.4% |
| Range | 27.8% | 43.0% |
| Mean | 13.5% | 15.2% |
| Median | 13.2% | 12.9% |
| Interquartile 25% (IQ1) | 10.7% | 11.7% |
| Interquartile 75% (IQ3) | 16.0% | 16.6% |
| Interquartile Range (IQR) | 5.3% | 4.8% |
| Standard Deviation (Sample) | 5.3% | 9.2% |
| Standard Deviation (Population) | 5.3% | 9.0% |
Similar Demographics by Poverty
Demographics Similar to Ecuadorians by Poverty
In terms of poverty, the demographic groups most similar to Ecuadorians are Sudanese (14.0%, a difference of 0.070%), Nepalese (14.0%, a difference of 0.10%), Salvadoran (14.0%, a difference of 0.31%), Immigrants from Middle Africa (14.0%, a difference of 0.34%), and Nicaraguan (13.9%, a difference of 0.46%).
| Demographics | Rating | Rank | Poverty |
| Cubans | 0.6 /100 | #235 | Tragic 13.9% |
| Immigrants | Armenia | 0.5 /100 | #236 | Tragic 13.9% |
| French American Indians | 0.5 /100 | #237 | Tragic 13.9% |
| Ghanaians | 0.5 /100 | #238 | Tragic 13.9% |
| Nicaraguans | 0.4 /100 | #239 | Tragic 13.9% |
| Immigrants | Middle Africa | 0.4 /100 | #240 | Tragic 14.0% |
| Salvadorans | 0.4 /100 | #241 | Tragic 14.0% |
| Ecuadorians | 0.4 /100 | #242 | Tragic 14.0% |
| Sudanese | 0.3 /100 | #243 | Tragic 14.0% |
| Nepalese | 0.3 /100 | #244 | Tragic 14.0% |
| Immigrants | Sudan | 0.3 /100 | #245 | Tragic 14.1% |
| Potawatomi | 0.3 /100 | #246 | Tragic 14.1% |
| Liberians | 0.2 /100 | #247 | Tragic 14.1% |
| Immigrants | Western Africa | 0.2 /100 | #248 | Tragic 14.1% |
| Immigrants | Ghana | 0.2 /100 | #249 | Tragic 14.2% |
Demographics Similar to Immigrants from Kenya by Poverty
In terms of poverty, the demographic groups most similar to Immigrants from Kenya are Spaniard (12.8%, a difference of 0.16%), Immigrants from Uganda (12.8%, a difference of 0.16%), Spanish (12.8%, a difference of 0.19%), Immigrants from Lebanon (12.8%, a difference of 0.20%), and Immigrants from Uruguay (12.8%, a difference of 0.32%).
| Demographics | Rating | Rank | Poverty |
| South American Indians | 23.3 /100 | #192 | Fair 12.7% |
| Delaware | 21.4 /100 | #193 | Fair 12.7% |
| Arabs | 21.1 /100 | #194 | Fair 12.7% |
| Immigrants | Kuwait | 20.9 /100 | #195 | Fair 12.7% |
| Iraqis | 20.8 /100 | #196 | Fair 12.7% |
| Immigrants | Lebanon | 18.7 /100 | #197 | Poor 12.8% |
| Spanish | 18.7 /100 | #198 | Poor 12.8% |
| Immigrants | Kenya | 17.5 /100 | #199 | Poor 12.8% |
| Spaniards | 16.5 /100 | #200 | Poor 12.8% |
| Immigrants | Uganda | 16.5 /100 | #201 | Poor 12.8% |
| Immigrants | Uruguay | 15.6 /100 | #202 | Poor 12.8% |
| Hmong | 15.0 /100 | #203 | Poor 12.8% |
| Immigrants | Western Asia | 14.1 /100 | #204 | Poor 12.9% |
| Tsimshian | 9.2 /100 | #205 | Tragic 13.0% |
| Immigrants | Eastern Africa | 7.0 /100 | #206 | Tragic 13.1% |