Immigrants from Caribbean vs Immigrants from Kenya Master's Degree
COMPARE
Immigrants from Caribbean
Immigrants from Kenya
Master's Degree
Master's Degree Comparison
Immigrants from Caribbean
Immigrants from Kenya
12.1%
MASTER'S DEGREE
0.3/ 100
METRIC RATING
277th/ 347
METRIC RANK
15.3%
MASTER'S DEGREE
66.6/ 100
METRIC RATING
165th/ 347
METRIC RANK
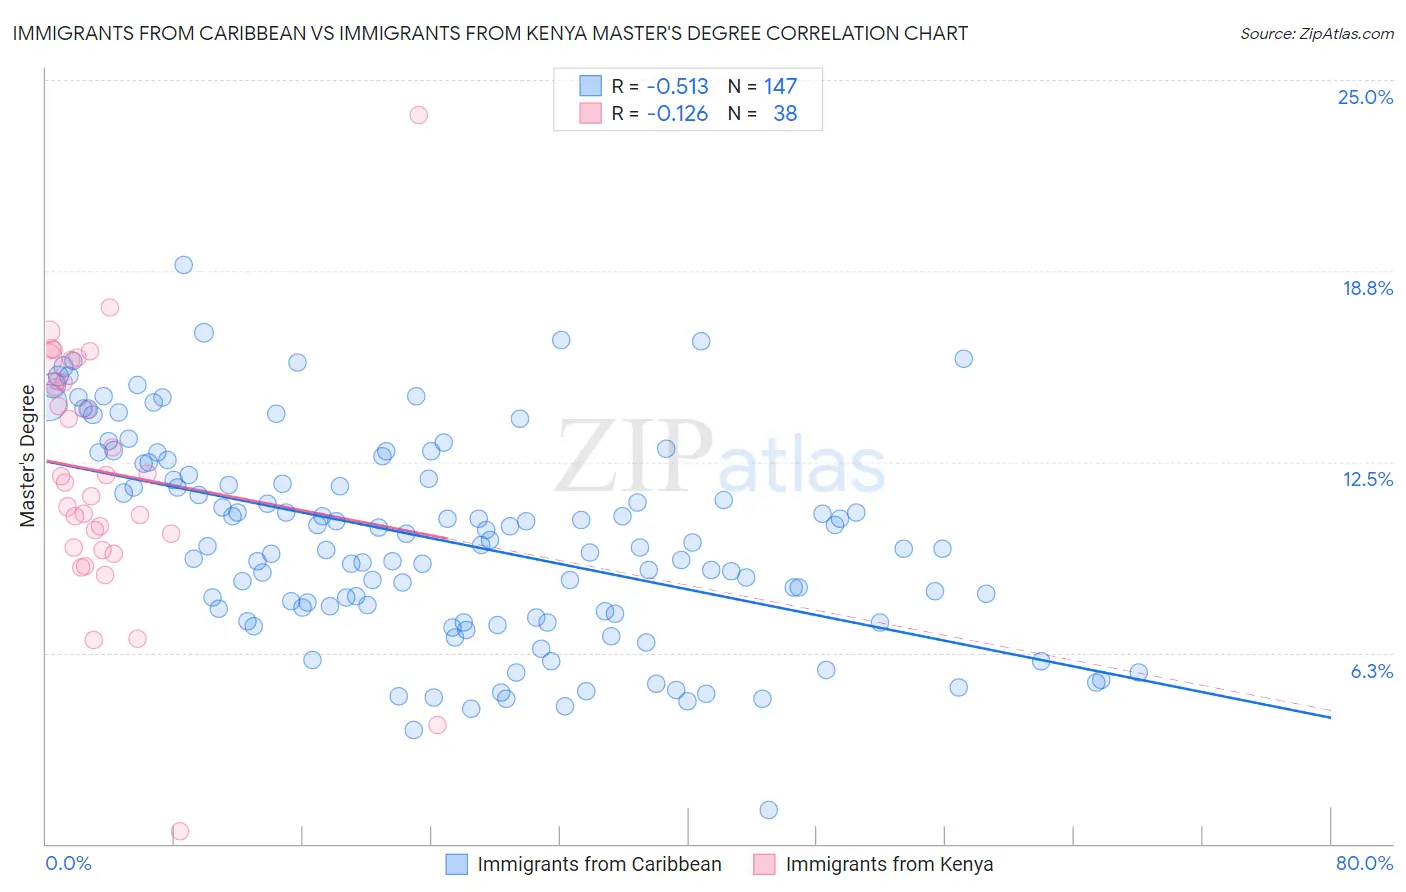
Immigrants from Caribbean vs Immigrants from Kenya Master's Degree Correlation Chart
The statistical analysis conducted on geographies consisting of 449,853,344 people shows a substantial negative correlation between the proportion of Immigrants from Caribbean and percentage of population with at least master's degree education in the United States with a correlation coefficient (R) of -0.513 and weighted average of 12.1%. Similarly, the statistical analysis conducted on geographies consisting of 218,048,721 people shows a poor negative correlation between the proportion of Immigrants from Kenya and percentage of population with at least master's degree education in the United States with a correlation coefficient (R) of -0.126 and weighted average of 15.3%, a difference of 26.4%.
Master's Degree Correlation Summary
| Measurement | Immigrants from Caribbean | Immigrants from Kenya |
| Minimum | 1.1% | 0.40% |
| Maximum | 18.9% | 23.9% |
| Range | 17.8% | 23.5% |
| Mean | 9.9% | 12.2% |
| Median | 9.7% | 11.9% |
| Interquartile 25% (IQ1) | 7.5% | 9.7% |
| Interquartile 75% (IQ3) | 12.4% | 15.2% |
| Interquartile Range (IQR) | 4.9% | 5.5% |
| Standard Deviation (Sample) | 3.3% | 4.2% |
| Standard Deviation (Population) | 3.3% | 4.1% |
Similar Demographics by Master's Degree
Demographics Similar to Immigrants from Caribbean by Master's Degree
In terms of master's degree, the demographic groups most similar to Immigrants from Caribbean are Potawatomi (12.1%, a difference of 0.0%), Black/African American (12.1%, a difference of 0.010%), Cuban (12.1%, a difference of 0.060%), Cape Verdean (12.1%, a difference of 0.080%), and Immigrants from Belize (12.1%, a difference of 0.080%).
| Demographics | Rating | Rank | Master's Degree |
| Salvadorans | 0.3 /100 | #270 | Tragic 12.2% |
| Haitians | 0.3 /100 | #271 | Tragic 12.1% |
| Comanche | 0.3 /100 | #272 | Tragic 12.1% |
| Blackfeet | 0.3 /100 | #273 | Tragic 12.1% |
| Cape Verdeans | 0.3 /100 | #274 | Tragic 12.1% |
| Cubans | 0.3 /100 | #275 | Tragic 12.1% |
| Blacks/African Americans | 0.3 /100 | #276 | Tragic 12.1% |
| Immigrants | Caribbean | 0.3 /100 | #277 | Tragic 12.1% |
| Potawatomi | 0.3 /100 | #278 | Tragic 12.1% |
| Immigrants | Belize | 0.2 /100 | #279 | Tragic 12.1% |
| Immigrants | Dominican Republic | 0.2 /100 | #280 | Tragic 12.1% |
| Malaysians | 0.2 /100 | #281 | Tragic 12.0% |
| Immigrants | El Salvador | 0.2 /100 | #282 | Tragic 12.0% |
| Hondurans | 0.2 /100 | #283 | Tragic 11.9% |
| Ottawa | 0.2 /100 | #284 | Tragic 11.9% |
Demographics Similar to Immigrants from Kenya by Master's Degree
In terms of master's degree, the demographic groups most similar to Immigrants from Kenya are Colombian (15.3%, a difference of 0.040%), Uruguayan (15.3%, a difference of 0.070%), Swedish (15.2%, a difference of 0.070%), Senegalese (15.2%, a difference of 0.15%), and Peruvian (15.3%, a difference of 0.29%).
| Demographics | Rating | Rank | Master's Degree |
| Immigrants | Poland | 71.5 /100 | #158 | Good 15.4% |
| Luxembourgers | 71.0 /100 | #159 | Good 15.3% |
| Kenyans | 70.3 /100 | #160 | Good 15.3% |
| Sudanese | 68.7 /100 | #161 | Good 15.3% |
| Peruvians | 68.7 /100 | #162 | Good 15.3% |
| Uruguayans | 67.1 /100 | #163 | Good 15.3% |
| Colombians | 66.9 /100 | #164 | Good 15.3% |
| Immigrants | Kenya | 66.6 /100 | #165 | Good 15.3% |
| Swedes | 66.1 /100 | #166 | Good 15.2% |
| Senegalese | 65.6 /100 | #167 | Good 15.2% |
| Immigrants | North Macedonia | 64.5 /100 | #168 | Good 15.2% |
| Scottish | 62.7 /100 | #169 | Good 15.2% |
| Irish | 56.3 /100 | #170 | Average 15.0% |
| Immigrants | Ghana | 53.6 /100 | #171 | Average 15.0% |
| Immigrants | Uruguay | 52.8 /100 | #172 | Average 15.0% |