Immigrants from Taiwan vs Immigrants from England Poverty
COMPARE
Immigrants from Taiwan
Immigrants from England
Poverty
Poverty Comparison
Immigrants from Taiwan
Immigrants from England
9.7%
POVERTY
100.0/ 100
METRIC RATING
4th/ 347
METRIC RANK
11.4%
POVERTY
96.2/ 100
METRIC RATING
85th/ 347
METRIC RANK
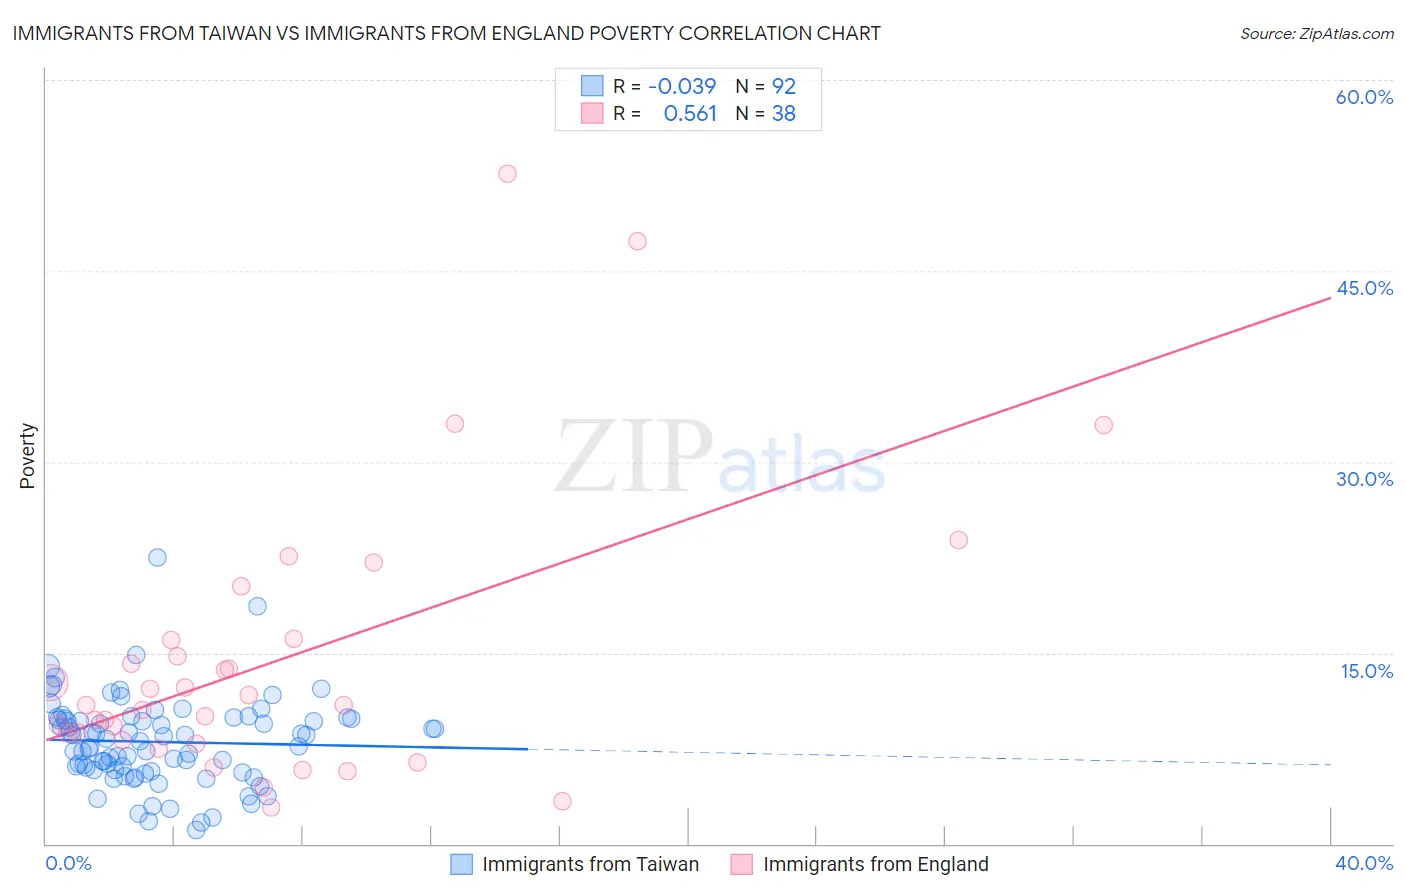
Immigrants from Taiwan vs Immigrants from England Poverty Correlation Chart
The statistical analysis conducted on geographies consisting of 298,124,801 people shows no correlation between the proportion of Immigrants from Taiwan and poverty level in the United States with a correlation coefficient (R) of -0.039 and weighted average of 9.7%. Similarly, the statistical analysis conducted on geographies consisting of 391,749,071 people shows a substantial positive correlation between the proportion of Immigrants from England and poverty level in the United States with a correlation coefficient (R) of 0.561 and weighted average of 11.4%, a difference of 16.7%.
Poverty Correlation Summary
| Measurement | Immigrants from Taiwan | Immigrants from England |
| Minimum | 1.1% | 2.8% |
| Maximum | 22.5% | 52.7% |
| Range | 21.4% | 49.8% |
| Mean | 8.0% | 14.4% |
| Median | 8.2% | 10.9% |
| Interquartile 25% (IQ1) | 5.8% | 8.2% |
| Interquartile 75% (IQ3) | 9.8% | 16.0% |
| Interquartile Range (IQR) | 4.0% | 7.8% |
| Standard Deviation (Sample) | 3.5% | 11.0% |
| Standard Deviation (Population) | 3.5% | 10.9% |
Similar Demographics by Poverty
Demographics Similar to Immigrants from Taiwan by Poverty
In terms of poverty, the demographic groups most similar to Immigrants from Taiwan are Thai (9.6%, a difference of 1.5%), Chinese (9.5%, a difference of 1.9%), Immigrants from Ireland (10.1%, a difference of 3.7%), Assyrian/Chaldean/Syriac (10.1%, a difference of 3.8%), and Filipino (10.1%, a difference of 4.0%).
| Demographics | Rating | Rank | Poverty |
| Immigrants | India | 100.0 /100 | #1 | Exceptional 9.0% |
| Chinese | 100.0 /100 | #2 | Exceptional 9.5% |
| Thais | 100.0 /100 | #3 | Exceptional 9.6% |
| Immigrants | Taiwan | 100.0 /100 | #4 | Exceptional 9.7% |
| Immigrants | Ireland | 99.9 /100 | #5 | Exceptional 10.1% |
| Assyrians/Chaldeans/Syriacs | 99.9 /100 | #6 | Exceptional 10.1% |
| Filipinos | 99.9 /100 | #7 | Exceptional 10.1% |
| Maltese | 99.9 /100 | #8 | Exceptional 10.2% |
| Immigrants | South Central Asia | 99.9 /100 | #9 | Exceptional 10.2% |
| Bulgarians | 99.9 /100 | #10 | Exceptional 10.2% |
| Immigrants | Lithuania | 99.9 /100 | #11 | Exceptional 10.3% |
| Bhutanese | 99.8 /100 | #12 | Exceptional 10.4% |
| Immigrants | Hong Kong | 99.8 /100 | #13 | Exceptional 10.4% |
| Immigrants | Bolivia | 99.8 /100 | #14 | Exceptional 10.4% |
| Bolivians | 99.8 /100 | #15 | Exceptional 10.4% |
Demographics Similar to Immigrants from England by Poverty
In terms of poverty, the demographic groups most similar to Immigrants from England are English (11.3%, a difference of 0.070%), Immigrants from Sweden (11.3%, a difference of 0.080%), Jordanian (11.4%, a difference of 0.12%), Northern European (11.4%, a difference of 0.12%), and Egyptian (11.3%, a difference of 0.25%).
| Demographics | Rating | Rank | Poverty |
| Dutch | 96.7 /100 | #78 | Exceptional 11.3% |
| Cambodians | 96.7 /100 | #79 | Exceptional 11.3% |
| Indians (Asian) | 96.6 /100 | #80 | Exceptional 11.3% |
| Irish | 96.6 /100 | #81 | Exceptional 11.3% |
| Egyptians | 96.5 /100 | #82 | Exceptional 11.3% |
| Immigrants | Sweden | 96.3 /100 | #83 | Exceptional 11.3% |
| English | 96.3 /100 | #84 | Exceptional 11.3% |
| Immigrants | England | 96.2 /100 | #85 | Exceptional 11.4% |
| Jordanians | 96.0 /100 | #86 | Exceptional 11.4% |
| Northern Europeans | 96.0 /100 | #87 | Exceptional 11.4% |
| Belgians | 95.8 /100 | #88 | Exceptional 11.4% |
| Czechoslovakians | 95.7 /100 | #89 | Exceptional 11.4% |
| Immigrants | Denmark | 95.5 /100 | #90 | Exceptional 11.4% |
| Finns | 95.2 /100 | #91 | Exceptional 11.4% |
| British | 95.0 /100 | #92 | Exceptional 11.4% |