Jordanian vs Immigrants from England Poverty
COMPARE
Jordanian
Immigrants from England
Poverty
Poverty Comparison
Jordanians
Immigrants from England
11.4%
POVERTY
96.0/ 100
METRIC RATING
86th/ 347
METRIC RANK
11.4%
POVERTY
96.2/ 100
METRIC RATING
85th/ 347
METRIC RANK
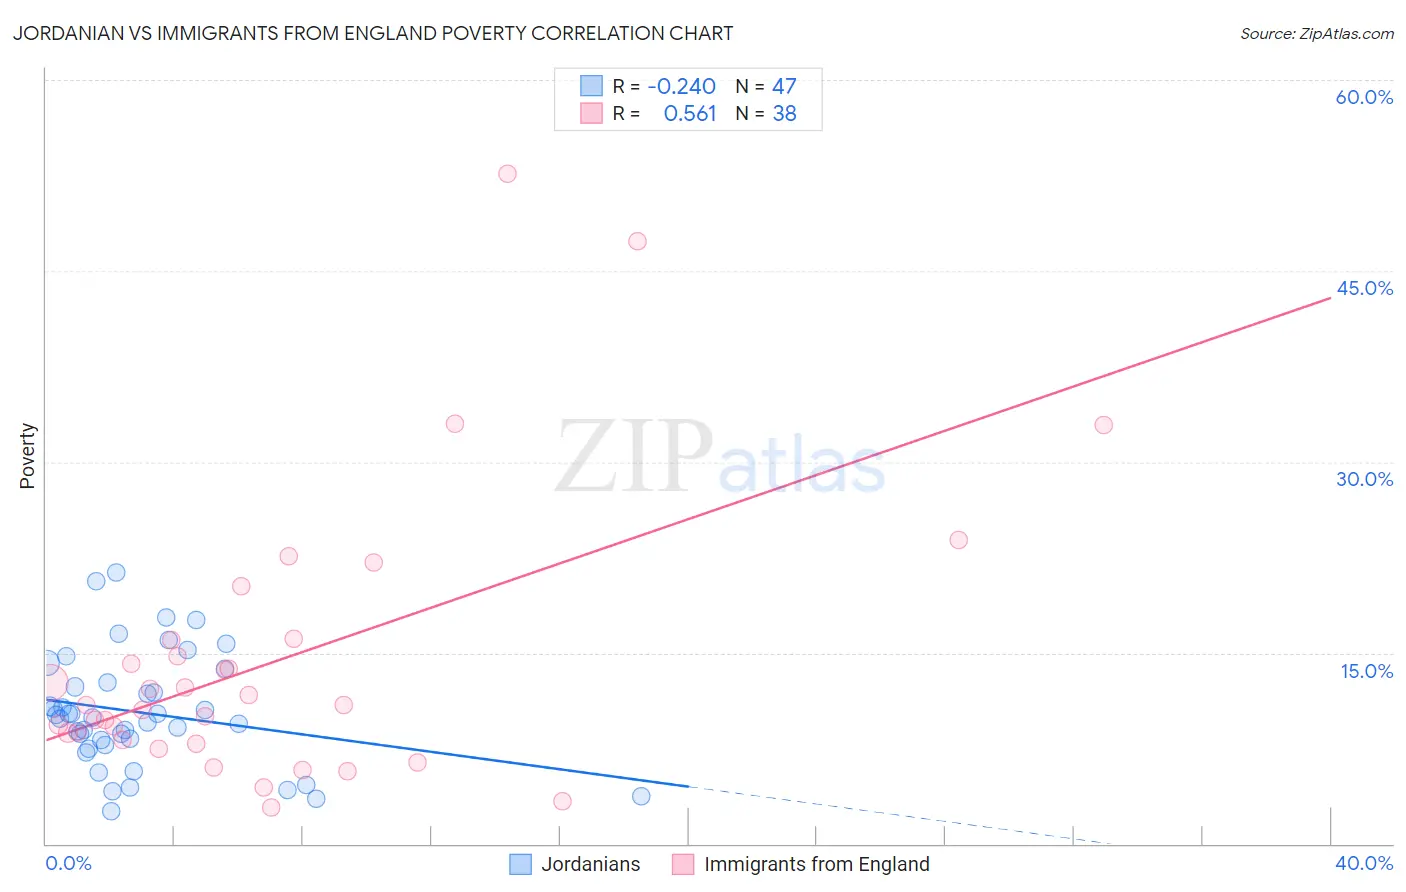
Jordanian vs Immigrants from England Poverty Correlation Chart
The statistical analysis conducted on geographies consisting of 166,402,418 people shows a weak negative correlation between the proportion of Jordanians and poverty level in the United States with a correlation coefficient (R) of -0.240 and weighted average of 11.4%. Similarly, the statistical analysis conducted on geographies consisting of 391,749,071 people shows a substantial positive correlation between the proportion of Immigrants from England and poverty level in the United States with a correlation coefficient (R) of 0.561 and weighted average of 11.4%, a difference of 0.12%.
Poverty Correlation Summary
| Measurement | Jordanian | Immigrants from England |
| Minimum | 2.5% | 2.8% |
| Maximum | 21.3% | 52.7% |
| Range | 18.7% | 49.8% |
| Mean | 10.3% | 14.4% |
| Median | 9.9% | 10.9% |
| Interquartile 25% (IQ1) | 7.7% | 8.2% |
| Interquartile 75% (IQ3) | 12.7% | 16.0% |
| Interquartile Range (IQR) | 5.0% | 7.8% |
| Standard Deviation (Sample) | 4.4% | 11.0% |
| Standard Deviation (Population) | 4.4% | 10.9% |
Demographics Similar to Jordanians and Immigrants from England by Poverty
In terms of poverty, the demographic groups most similar to Jordanians are Northern European (11.4%, a difference of 0.0%), Belgian (11.4%, a difference of 0.14%), English (11.3%, a difference of 0.18%), Czechoslovakian (11.4%, a difference of 0.18%), and Immigrants from Sweden (11.3%, a difference of 0.19%). Similarly, the demographic groups most similar to Immigrants from England are English (11.3%, a difference of 0.070%), Immigrants from Sweden (11.3%, a difference of 0.080%), Northern European (11.4%, a difference of 0.12%), Egyptian (11.3%, a difference of 0.25%), and Belgian (11.4%, a difference of 0.26%).
| Demographics | Rating | Rank | Poverty |
| Immigrants | Eastern Europe | 97.0 /100 | #75 | Exceptional 11.3% |
| Immigrants | North America | 96.8 /100 | #76 | Exceptional 11.3% |
| Immigrants | Eastern Asia | 96.7 /100 | #77 | Exceptional 11.3% |
| Dutch | 96.7 /100 | #78 | Exceptional 11.3% |
| Cambodians | 96.7 /100 | #79 | Exceptional 11.3% |
| Indians (Asian) | 96.6 /100 | #80 | Exceptional 11.3% |
| Irish | 96.6 /100 | #81 | Exceptional 11.3% |
| Egyptians | 96.5 /100 | #82 | Exceptional 11.3% |
| Immigrants | Sweden | 96.3 /100 | #83 | Exceptional 11.3% |
| English | 96.3 /100 | #84 | Exceptional 11.3% |
| Immigrants | England | 96.2 /100 | #85 | Exceptional 11.4% |
| Jordanians | 96.0 /100 | #86 | Exceptional 11.4% |
| Northern Europeans | 96.0 /100 | #87 | Exceptional 11.4% |
| Belgians | 95.8 /100 | #88 | Exceptional 11.4% |
| Czechoslovakians | 95.7 /100 | #89 | Exceptional 11.4% |
| Immigrants | Denmark | 95.5 /100 | #90 | Exceptional 11.4% |
| Finns | 95.2 /100 | #91 | Exceptional 11.4% |
| British | 95.0 /100 | #92 | Exceptional 11.4% |
| Romanians | 94.9 /100 | #93 | Exceptional 11.4% |
| Paraguayans | 94.9 /100 | #94 | Exceptional 11.4% |
| Australians | 94.9 /100 | #95 | Exceptional 11.4% |