Somali vs Immigrants from England Poverty
COMPARE
Somali
Immigrants from England
Poverty
Poverty Comparison
Somalis
Immigrants from England
15.4%
POVERTY
0.0/ 100
METRIC RATING
302nd/ 347
METRIC RANK
11.4%
POVERTY
96.2/ 100
METRIC RATING
85th/ 347
METRIC RANK
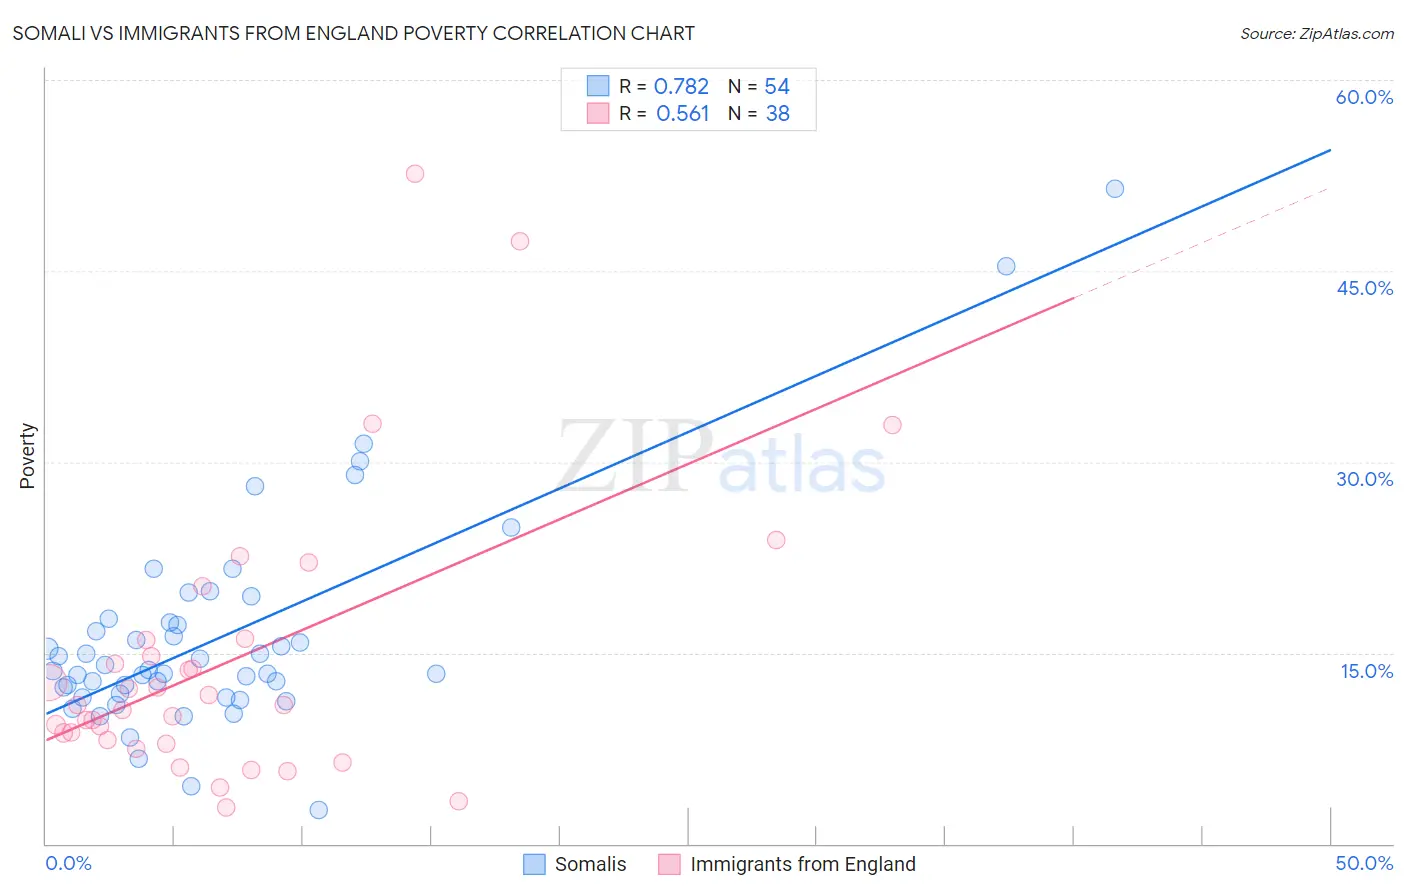
Somali vs Immigrants from England Poverty Correlation Chart
The statistical analysis conducted on geographies consisting of 99,289,063 people shows a strong positive correlation between the proportion of Somalis and poverty level in the United States with a correlation coefficient (R) of 0.782 and weighted average of 15.4%. Similarly, the statistical analysis conducted on geographies consisting of 391,749,071 people shows a substantial positive correlation between the proportion of Immigrants from England and poverty level in the United States with a correlation coefficient (R) of 0.561 and weighted average of 11.4%, a difference of 35.7%.
Poverty Correlation Summary
| Measurement | Somali | Immigrants from England |
| Minimum | 2.7% | 2.8% |
| Maximum | 51.5% | 52.7% |
| Range | 48.8% | 49.8% |
| Mean | 16.2% | 14.4% |
| Median | 13.6% | 10.9% |
| Interquartile 25% (IQ1) | 11.8% | 8.2% |
| Interquartile 75% (IQ3) | 17.4% | 16.0% |
| Interquartile Range (IQR) | 5.6% | 7.8% |
| Standard Deviation (Sample) | 8.6% | 11.0% |
| Standard Deviation (Population) | 8.5% | 10.9% |
Similar Demographics by Poverty
Demographics Similar to Somalis by Poverty
In terms of poverty, the demographic groups most similar to Somalis are Bahamian (15.4%, a difference of 0.13%), Immigrants from Central America (15.4%, a difference of 0.34%), Immigrants from Caribbean (15.5%, a difference of 0.48%), Immigrants from Mexico (15.5%, a difference of 0.57%), and Immigrants from Guatemala (15.5%, a difference of 0.61%).
| Demographics | Rating | Rank | Poverty |
| Guatemalans | 0.0 /100 | #295 | Tragic 15.3% |
| Hispanics or Latinos | 0.0 /100 | #296 | Tragic 15.3% |
| Immigrants | Bangladesh | 0.0 /100 | #297 | Tragic 15.3% |
| Immigrants | Senegal | 0.0 /100 | #298 | Tragic 15.3% |
| Senegalese | 0.0 /100 | #299 | Tragic 15.3% |
| Immigrants | Central America | 0.0 /100 | #300 | Tragic 15.4% |
| Bahamians | 0.0 /100 | #301 | Tragic 15.4% |
| Somalis | 0.0 /100 | #302 | Tragic 15.4% |
| Immigrants | Caribbean | 0.0 /100 | #303 | Tragic 15.5% |
| Immigrants | Mexico | 0.0 /100 | #304 | Tragic 15.5% |
| Immigrants | Guatemala | 0.0 /100 | #305 | Tragic 15.5% |
| Creek | 0.0 /100 | #306 | Tragic 15.6% |
| Africans | 0.0 /100 | #307 | Tragic 15.6% |
| Choctaw | 0.0 /100 | #308 | Tragic 15.6% |
| Seminole | 0.0 /100 | #309 | Tragic 15.6% |
Demographics Similar to Immigrants from England by Poverty
In terms of poverty, the demographic groups most similar to Immigrants from England are English (11.3%, a difference of 0.070%), Immigrants from Sweden (11.3%, a difference of 0.080%), Jordanian (11.4%, a difference of 0.12%), Northern European (11.4%, a difference of 0.12%), and Egyptian (11.3%, a difference of 0.25%).
| Demographics | Rating | Rank | Poverty |
| Dutch | 96.7 /100 | #78 | Exceptional 11.3% |
| Cambodians | 96.7 /100 | #79 | Exceptional 11.3% |
| Indians (Asian) | 96.6 /100 | #80 | Exceptional 11.3% |
| Irish | 96.6 /100 | #81 | Exceptional 11.3% |
| Egyptians | 96.5 /100 | #82 | Exceptional 11.3% |
| Immigrants | Sweden | 96.3 /100 | #83 | Exceptional 11.3% |
| English | 96.3 /100 | #84 | Exceptional 11.3% |
| Immigrants | England | 96.2 /100 | #85 | Exceptional 11.4% |
| Jordanians | 96.0 /100 | #86 | Exceptional 11.4% |
| Northern Europeans | 96.0 /100 | #87 | Exceptional 11.4% |
| Belgians | 95.8 /100 | #88 | Exceptional 11.4% |
| Czechoslovakians | 95.7 /100 | #89 | Exceptional 11.4% |
| Immigrants | Denmark | 95.5 /100 | #90 | Exceptional 11.4% |
| Finns | 95.2 /100 | #91 | Exceptional 11.4% |
| British | 95.0 /100 | #92 | Exceptional 11.4% |