Immigrants from Bosnia and Herzegovina vs Shoshone Married-Couple Family Poverty
COMPARE
Immigrants from Bosnia and Herzegovina
Shoshone
Married-Couple Family Poverty
Married-Couple Family Poverty Comparison
Immigrants from Bosnia and Herzegovina
Shoshone
4.8%
MARRIED-COUPLE FAMILY POVERTY
92.5/ 100
METRIC RATING
125th/ 347
METRIC RANK
6.1%
MARRIED-COUPLE FAMILY POVERTY
0.3/ 100
METRIC RATING
262nd/ 347
METRIC RANK
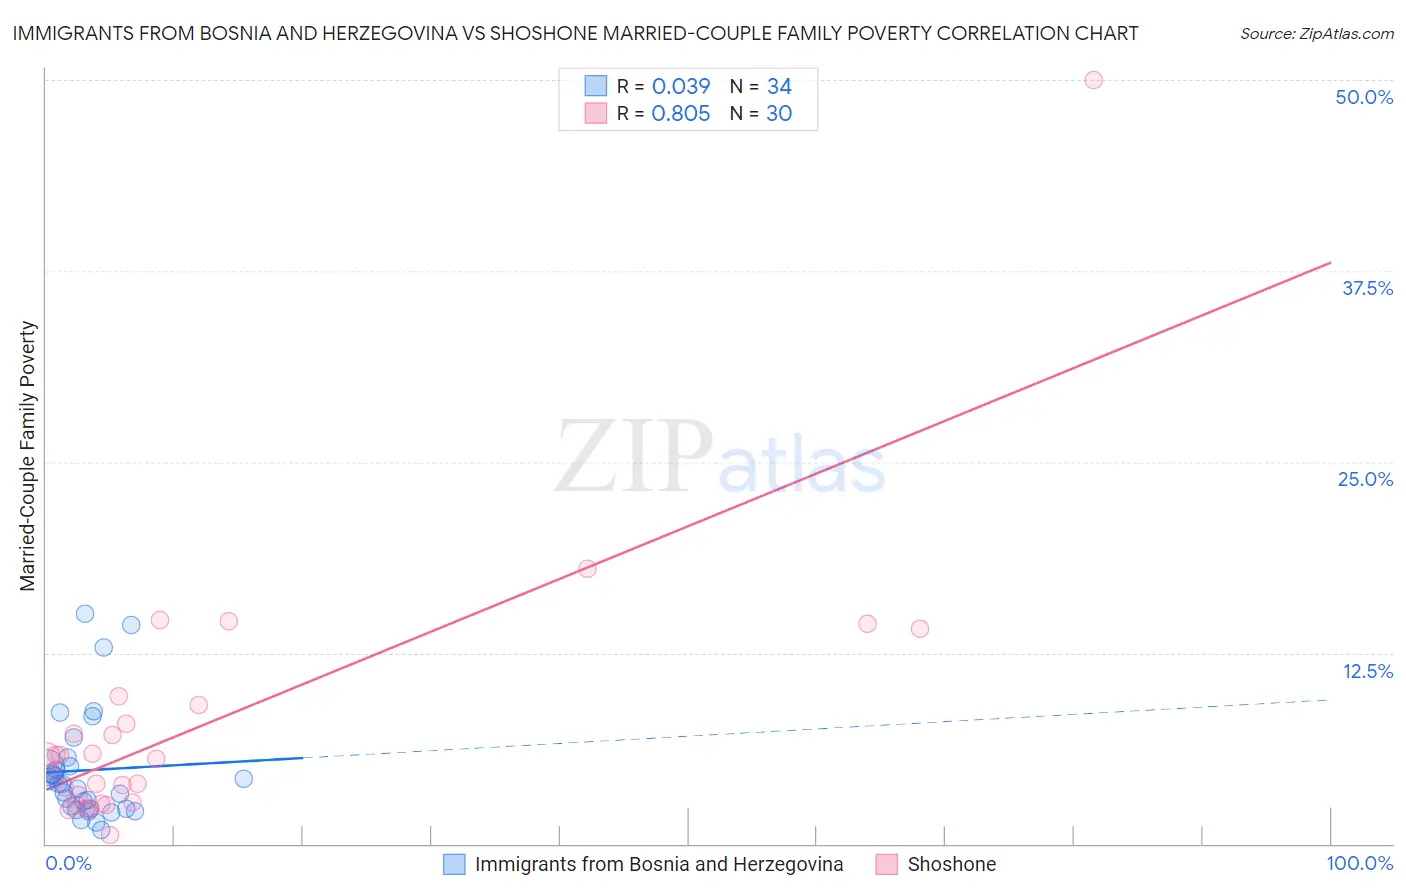
Immigrants from Bosnia and Herzegovina vs Shoshone Married-Couple Family Poverty Correlation Chart
The statistical analysis conducted on geographies consisting of 156,293,901 people shows no correlation between the proportion of Immigrants from Bosnia and Herzegovina and poverty level among married-couple families in the United States with a correlation coefficient (R) of 0.039 and weighted average of 4.8%. Similarly, the statistical analysis conducted on geographies consisting of 66,505,445 people shows a very strong positive correlation between the proportion of Shoshone and poverty level among married-couple families in the United States with a correlation coefficient (R) of 0.805 and weighted average of 6.1%, a difference of 26.1%.
Married-Couple Family Poverty Correlation Summary
| Measurement | Immigrants from Bosnia and Herzegovina | Shoshone |
| Minimum | 0.92% | 0.60% |
| Maximum | 15.1% | 50.0% |
| Range | 14.1% | 49.4% |
| Mean | 4.8% | 7.9% |
| Median | 3.9% | 5.6% |
| Interquartile 25% (IQ1) | 2.3% | 2.7% |
| Interquartile 75% (IQ3) | 5.1% | 9.1% |
| Interquartile Range (IQR) | 2.7% | 6.4% |
| Standard Deviation (Sample) | 3.5% | 9.2% |
| Standard Deviation (Population) | 3.5% | 9.0% |
Similar Demographics by Married-Couple Family Poverty
Demographics Similar to Immigrants from Bosnia and Herzegovina by Married-Couple Family Poverty
In terms of married-couple family poverty, the demographic groups most similar to Immigrants from Bosnia and Herzegovina are Romanian (4.8%, a difference of 0.020%), Immigrants from Asia (4.8%, a difference of 0.070%), Egyptian (4.8%, a difference of 0.21%), Jordanian (4.8%, a difference of 0.29%), and White/Caucasian (4.8%, a difference of 0.30%).
| Demographics | Rating | Rank | Married-Couple Family Poverty |
| Immigrants | Philippines | 94.6 /100 | #118 | Exceptional 4.8% |
| Immigrants | Eastern Asia | 94.0 /100 | #119 | Exceptional 4.8% |
| Immigrants | Southern Europe | 93.4 /100 | #120 | Exceptional 4.8% |
| Indians (Asian) | 93.2 /100 | #121 | Exceptional 4.8% |
| Whites/Caucasians | 93.1 /100 | #122 | Exceptional 4.8% |
| Jordanians | 93.1 /100 | #123 | Exceptional 4.8% |
| Romanians | 92.5 /100 | #124 | Exceptional 4.8% |
| Immigrants | Bosnia and Herzegovina | 92.5 /100 | #125 | Exceptional 4.8% |
| Immigrants | Asia | 92.3 /100 | #126 | Exceptional 4.8% |
| Egyptians | 92.0 /100 | #127 | Exceptional 4.8% |
| Palestinians | 91.2 /100 | #128 | Exceptional 4.9% |
| Immigrants | Pakistan | 90.7 /100 | #129 | Exceptional 4.9% |
| Soviet Union | 90.7 /100 | #130 | Exceptional 4.9% |
| Immigrants | Eastern Europe | 90.5 /100 | #131 | Exceptional 4.9% |
| Puget Sound Salish | 90.4 /100 | #132 | Exceptional 4.9% |
Demographics Similar to Shoshone by Married-Couple Family Poverty
In terms of married-couple family poverty, the demographic groups most similar to Shoshone are Senegalese (6.1%, a difference of 0.21%), Immigrants from Senegal (6.1%, a difference of 0.39%), Jamaican (6.1%, a difference of 0.40%), Alaskan Athabascan (6.1%, a difference of 0.61%), and Immigrants from Congo (6.1%, a difference of 0.62%).
| Demographics | Rating | Rank | Married-Couple Family Poverty |
| Comanche | 0.7 /100 | #255 | Tragic 6.0% |
| Bangladeshis | 0.5 /100 | #256 | Tragic 6.0% |
| Immigrants | Burma/Myanmar | 0.5 /100 | #257 | Tragic 6.0% |
| Immigrants | Immigrants | 0.5 /100 | #258 | Tragic 6.0% |
| Alaskan Athabascans | 0.4 /100 | #259 | Tragic 6.1% |
| Jamaicans | 0.3 /100 | #260 | Tragic 6.1% |
| Senegalese | 0.3 /100 | #261 | Tragic 6.1% |
| Shoshone | 0.3 /100 | #262 | Tragic 6.1% |
| Immigrants | Senegal | 0.3 /100 | #263 | Tragic 6.1% |
| Immigrants | Congo | 0.2 /100 | #264 | Tragic 6.1% |
| Blackfeet | 0.2 /100 | #265 | Tragic 6.2% |
| Creek | 0.2 /100 | #266 | Tragic 6.2% |
| Spanish Americans | 0.2 /100 | #267 | Tragic 6.2% |
| Alaska Natives | 0.2 /100 | #268 | Tragic 6.2% |
| Immigrants | West Indies | 0.1 /100 | #269 | Tragic 6.2% |