Immigrants from Bosnia and Herzegovina vs Shoshone High School Diploma
COMPARE
Immigrants from Bosnia and Herzegovina
Shoshone
High School Diploma
High School Diploma Comparison
Immigrants from Bosnia and Herzegovina
Shoshone
89.8%
HIGH SCHOOL DIPLOMA
87.3/ 100
METRIC RATING
132nd/ 347
METRIC RANK
88.3%
HIGH SCHOOL DIPLOMA
7.0/ 100
METRIC RATING
224th/ 347
METRIC RANK
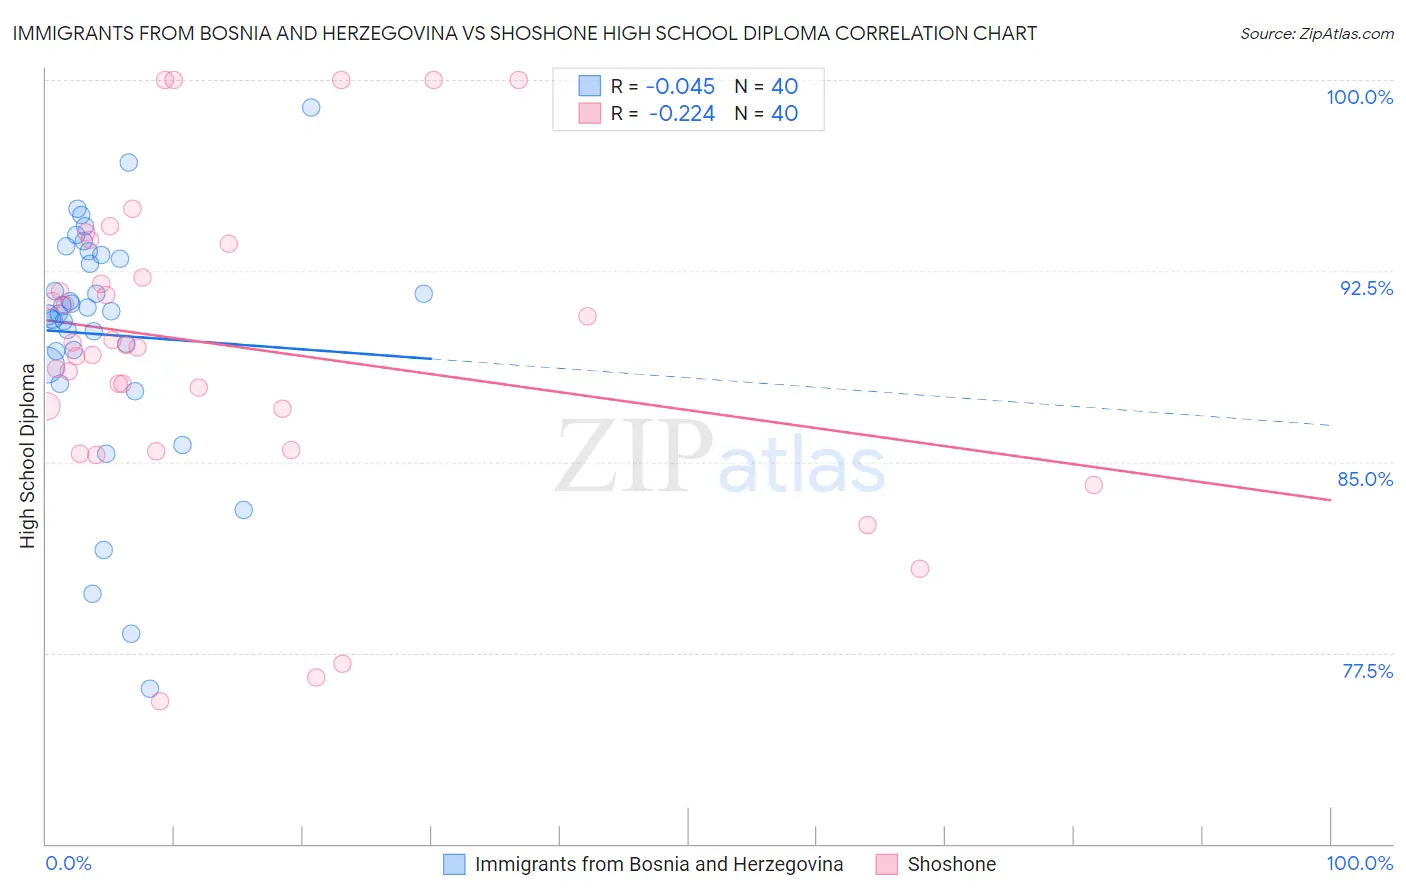
Immigrants from Bosnia and Herzegovina vs Shoshone High School Diploma Correlation Chart
The statistical analysis conducted on geographies consisting of 156,819,615 people shows no correlation between the proportion of Immigrants from Bosnia and Herzegovina and percentage of population with at least high school diploma education in the United States with a correlation coefficient (R) of -0.045 and weighted average of 89.8%. Similarly, the statistical analysis conducted on geographies consisting of 66,627,351 people shows a weak negative correlation between the proportion of Shoshone and percentage of population with at least high school diploma education in the United States with a correlation coefficient (R) of -0.224 and weighted average of 88.3%, a difference of 1.7%.
High School Diploma Correlation Summary
| Measurement | Immigrants from Bosnia and Herzegovina | Shoshone |
| Minimum | 76.1% | 75.6% |
| Maximum | 98.9% | 100.0% |
| Range | 22.8% | 24.4% |
| Mean | 90.0% | 89.5% |
| Median | 90.9% | 89.5% |
| Interquartile 25% (IQ1) | 89.1% | 86.3% |
| Interquartile 75% (IQ3) | 93.1% | 92.9% |
| Interquartile Range (IQR) | 4.0% | 6.6% |
| Standard Deviation (Sample) | 4.8% | 6.1% |
| Standard Deviation (Population) | 4.7% | 6.0% |
Similar Demographics by High School Diploma
Demographics Similar to Immigrants from Bosnia and Herzegovina by High School Diploma
In terms of high school diploma, the demographic groups most similar to Immigrants from Bosnia and Herzegovina are Immigrants from Italy (89.8%, a difference of 0.0%), Albanian (89.8%, a difference of 0.0%), Immigrants from Jordan (89.8%, a difference of 0.0%), Immigrants from Ukraine (89.8%, a difference of 0.020%), and Basque (89.8%, a difference of 0.040%).
| Demographics | Rating | Rank | High School Diploma |
| Egyptians | 91.1 /100 | #125 | Exceptional 89.9% |
| Alaska Natives | 91.0 /100 | #126 | Exceptional 89.9% |
| Immigrants | Eastern Asia | 89.2 /100 | #127 | Excellent 89.9% |
| Puget Sound Salish | 89.1 /100 | #128 | Excellent 89.9% |
| Basques | 88.5 /100 | #129 | Excellent 89.8% |
| Immigrants | Ukraine | 87.9 /100 | #130 | Excellent 89.8% |
| Immigrants | Italy | 87.4 /100 | #131 | Excellent 89.8% |
| Immigrants | Bosnia and Herzegovina | 87.3 /100 | #132 | Excellent 89.8% |
| Albanians | 87.2 /100 | #133 | Excellent 89.8% |
| Immigrants | Jordan | 87.2 /100 | #134 | Excellent 89.8% |
| Chippewa | 85.6 /100 | #135 | Excellent 89.7% |
| Ugandans | 83.7 /100 | #136 | Excellent 89.7% |
| Arabs | 83.6 /100 | #137 | Excellent 89.7% |
| Assyrians/Chaldeans/Syriacs | 82.5 /100 | #138 | Excellent 89.7% |
| Kenyans | 81.4 /100 | #139 | Excellent 89.6% |
Demographics Similar to Shoshone by High School Diploma
In terms of high school diploma, the demographic groups most similar to Shoshone are Creek (88.3%, a difference of 0.010%), Colville (88.3%, a difference of 0.040%), Immigrants from Zaire (88.3%, a difference of 0.040%), Immigrants from Afghanistan (88.3%, a difference of 0.090%), and Uruguayan (88.2%, a difference of 0.090%).
| Demographics | Rating | Rank | High School Diploma |
| Immigrants | Africa | 10.6 /100 | #217 | Poor 88.4% |
| Immigrants | Bolivia | 10.3 /100 | #218 | Poor 88.4% |
| Costa Ricans | 9.6 /100 | #219 | Tragic 88.4% |
| Tongans | 9.5 /100 | #220 | Tragic 88.4% |
| Immigrants | Afghanistan | 8.6 /100 | #221 | Tragic 88.3% |
| Colville | 7.8 /100 | #222 | Tragic 88.3% |
| Immigrants | Zaire | 7.6 /100 | #223 | Tragic 88.3% |
| Shoshone | 7.0 /100 | #224 | Tragic 88.3% |
| Creek | 6.9 /100 | #225 | Tragic 88.3% |
| Uruguayans | 5.6 /100 | #226 | Tragic 88.2% |
| Immigrants | Liberia | 5.5 /100 | #227 | Tragic 88.2% |
| Kiowa | 5.3 /100 | #228 | Tragic 88.2% |
| Nigerians | 5.2 /100 | #229 | Tragic 88.2% |
| Blackfeet | 4.2 /100 | #230 | Tragic 88.1% |
| Colombians | 3.8 /100 | #231 | Tragic 88.1% |