Immigrants from Bosnia and Herzegovina vs Immigrants from Egypt Married-Couple Family Poverty
COMPARE
Immigrants from Bosnia and Herzegovina
Immigrants from Egypt
Married-Couple Family Poverty
Married-Couple Family Poverty Comparison
Immigrants from Bosnia and Herzegovina
Immigrants from Egypt
4.8%
MARRIED-COUPLE FAMILY POVERTY
92.5/ 100
METRIC RATING
125th/ 347
METRIC RANK
5.0%
MARRIED-COUPLE FAMILY POVERTY
83.4/ 100
METRIC RATING
143rd/ 347
METRIC RANK
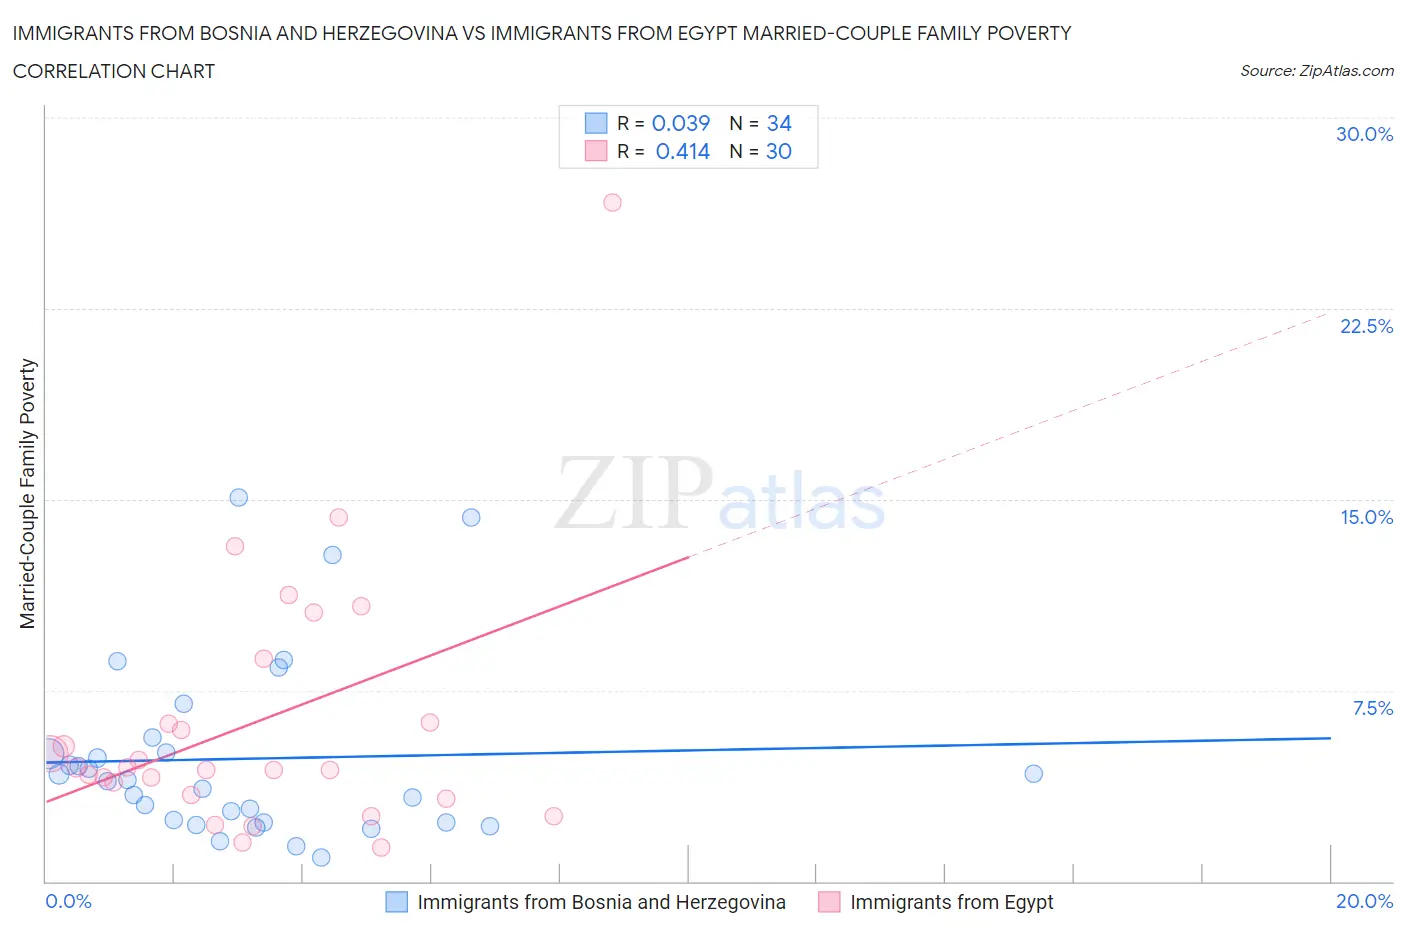
Immigrants from Bosnia and Herzegovina vs Immigrants from Egypt Married-Couple Family Poverty Correlation Chart
The statistical analysis conducted on geographies consisting of 156,293,901 people shows no correlation between the proportion of Immigrants from Bosnia and Herzegovina and poverty level among married-couple families in the United States with a correlation coefficient (R) of 0.039 and weighted average of 4.8%. Similarly, the statistical analysis conducted on geographies consisting of 244,341,111 people shows a moderate positive correlation between the proportion of Immigrants from Egypt and poverty level among married-couple families in the United States with a correlation coefficient (R) of 0.414 and weighted average of 5.0%, a difference of 2.8%.
Married-Couple Family Poverty Correlation Summary
| Measurement | Immigrants from Bosnia and Herzegovina | Immigrants from Egypt |
| Minimum | 0.92% | 1.3% |
| Maximum | 15.1% | 26.7% |
| Range | 14.1% | 25.4% |
| Mean | 4.8% | 6.2% |
| Median | 3.9% | 4.4% |
| Interquartile 25% (IQ1) | 2.3% | 3.4% |
| Interquartile 75% (IQ3) | 5.1% | 6.3% |
| Interquartile Range (IQR) | 2.7% | 2.9% |
| Standard Deviation (Sample) | 3.5% | 5.1% |
| Standard Deviation (Population) | 3.5% | 5.0% |
Demographics Similar to Immigrants from Bosnia and Herzegovina and Immigrants from Egypt by Married-Couple Family Poverty
In terms of married-couple family poverty, the demographic groups most similar to Immigrants from Bosnia and Herzegovina are Romanian (4.8%, a difference of 0.020%), Immigrants from Asia (4.8%, a difference of 0.070%), Egyptian (4.8%, a difference of 0.21%), Palestinian (4.9%, a difference of 0.53%), and Immigrants from Pakistan (4.9%, a difference of 0.74%). Similarly, the demographic groups most similar to Immigrants from Egypt are Hmong (5.0%, a difference of 0.050%), Immigrants from Brazil (5.0%, a difference of 0.27%), Immigrants from China (5.0%, a difference of 0.27%), Immigrants from Portugal (5.0%, a difference of 0.32%), and German Russian (5.0%, a difference of 0.38%).
| Demographics | Rating | Rank | Married-Couple Family Poverty |
| Romanians | 92.5 /100 | #124 | Exceptional 4.8% |
| Immigrants | Bosnia and Herzegovina | 92.5 /100 | #125 | Exceptional 4.8% |
| Immigrants | Asia | 92.3 /100 | #126 | Exceptional 4.8% |
| Egyptians | 92.0 /100 | #127 | Exceptional 4.8% |
| Palestinians | 91.2 /100 | #128 | Exceptional 4.9% |
| Immigrants | Pakistan | 90.7 /100 | #129 | Exceptional 4.9% |
| Soviet Union | 90.7 /100 | #130 | Exceptional 4.9% |
| Immigrants | Eastern Europe | 90.5 /100 | #131 | Exceptional 4.9% |
| Puget Sound Salish | 90.4 /100 | #132 | Exceptional 4.9% |
| Immigrants | Kenya | 90.2 /100 | #133 | Exceptional 4.9% |
| Samoans | 90.2 /100 | #134 | Exceptional 4.9% |
| Assyrians/Chaldeans/Syriacs | 89.4 /100 | #135 | Excellent 4.9% |
| Immigrants | Hungary | 88.7 /100 | #136 | Excellent 4.9% |
| Guamanians/Chamorros | 86.5 /100 | #137 | Excellent 4.9% |
| Chileans | 86.0 /100 | #138 | Excellent 4.9% |
| German Russians | 85.1 /100 | #139 | Excellent 5.0% |
| Immigrants | Portugal | 84.8 /100 | #140 | Excellent 5.0% |
| Immigrants | Brazil | 84.6 /100 | #141 | Excellent 5.0% |
| Immigrants | China | 84.6 /100 | #142 | Excellent 5.0% |
| Immigrants | Egypt | 83.4 /100 | #143 | Excellent 5.0% |
| Hmong | 83.2 /100 | #144 | Excellent 5.0% |