Immigrants from Bosnia and Herzegovina vs Barbadian Married-Couple Family Poverty
COMPARE
Immigrants from Bosnia and Herzegovina
Barbadian
Married-Couple Family Poverty
Married-Couple Family Poverty Comparison
Immigrants from Bosnia and Herzegovina
Barbadians
4.8%
MARRIED-COUPLE FAMILY POVERTY
92.5/ 100
METRIC RATING
125th/ 347
METRIC RANK
6.3%
MARRIED-COUPLE FAMILY POVERTY
0.1/ 100
METRIC RATING
274th/ 347
METRIC RANK
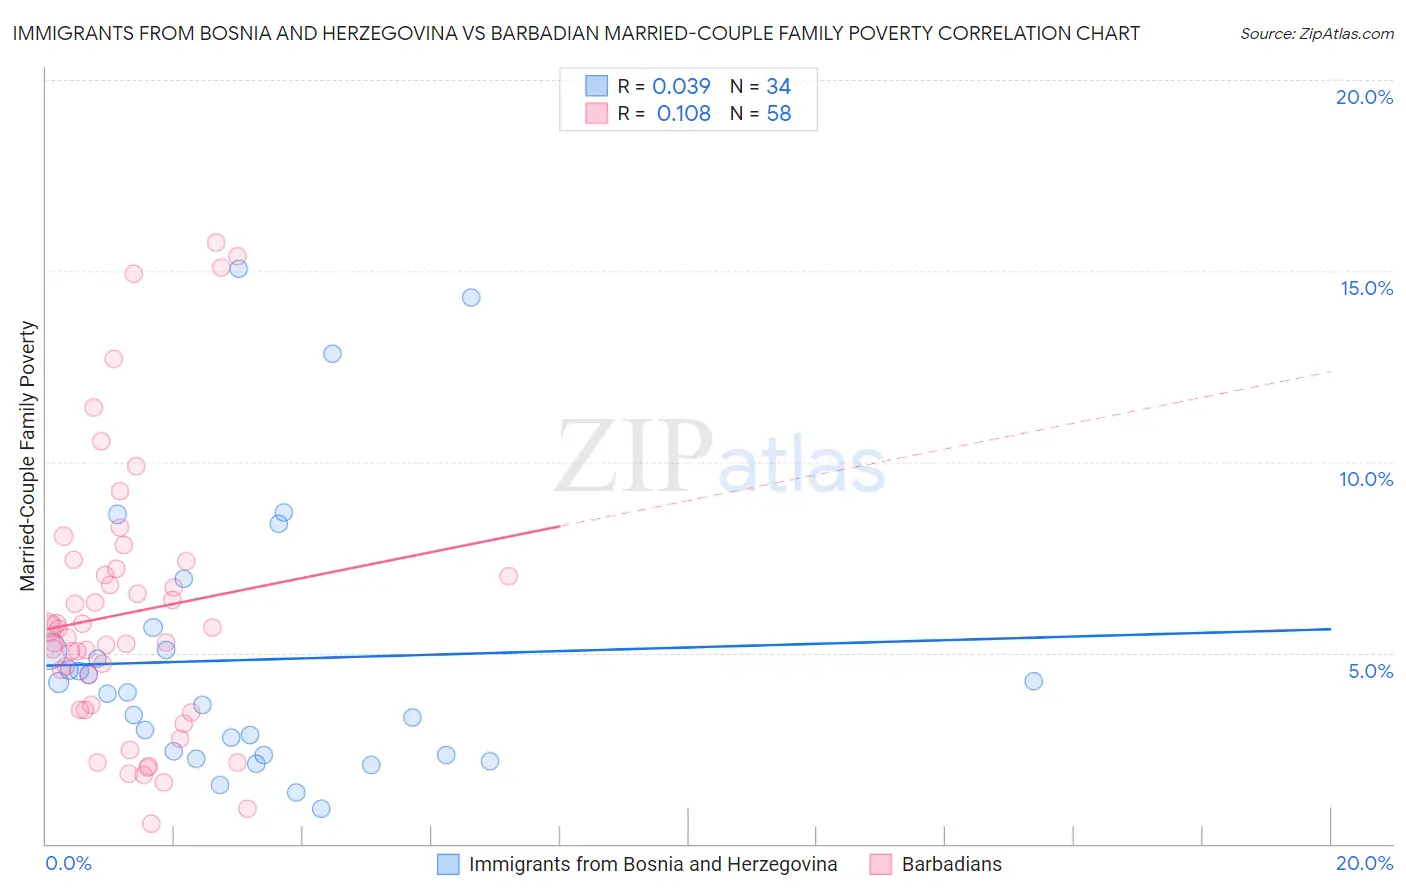
Immigrants from Bosnia and Herzegovina vs Barbadian Married-Couple Family Poverty Correlation Chart
The statistical analysis conducted on geographies consisting of 156,293,901 people shows no correlation between the proportion of Immigrants from Bosnia and Herzegovina and poverty level among married-couple families in the United States with a correlation coefficient (R) of 0.039 and weighted average of 4.8%. Similarly, the statistical analysis conducted on geographies consisting of 140,986,203 people shows a poor positive correlation between the proportion of Barbadians and poverty level among married-couple families in the United States with a correlation coefficient (R) of 0.108 and weighted average of 6.3%, a difference of 29.9%.
Married-Couple Family Poverty Correlation Summary
| Measurement | Immigrants from Bosnia and Herzegovina | Barbadian |
| Minimum | 0.92% | 0.52% |
| Maximum | 15.1% | 15.7% |
| Range | 14.1% | 15.2% |
| Mean | 4.8% | 6.0% |
| Median | 3.9% | 5.5% |
| Interquartile 25% (IQ1) | 2.3% | 3.5% |
| Interquartile 75% (IQ3) | 5.1% | 7.2% |
| Interquartile Range (IQR) | 2.7% | 3.7% |
| Standard Deviation (Sample) | 3.5% | 3.6% |
| Standard Deviation (Population) | 3.5% | 3.5% |
Similar Demographics by Married-Couple Family Poverty
Demographics Similar to Immigrants from Bosnia and Herzegovina by Married-Couple Family Poverty
In terms of married-couple family poverty, the demographic groups most similar to Immigrants from Bosnia and Herzegovina are Romanian (4.8%, a difference of 0.020%), Immigrants from Asia (4.8%, a difference of 0.070%), Egyptian (4.8%, a difference of 0.21%), Jordanian (4.8%, a difference of 0.29%), and White/Caucasian (4.8%, a difference of 0.30%).
| Demographics | Rating | Rank | Married-Couple Family Poverty |
| Immigrants | Philippines | 94.6 /100 | #118 | Exceptional 4.8% |
| Immigrants | Eastern Asia | 94.0 /100 | #119 | Exceptional 4.8% |
| Immigrants | Southern Europe | 93.4 /100 | #120 | Exceptional 4.8% |
| Indians (Asian) | 93.2 /100 | #121 | Exceptional 4.8% |
| Whites/Caucasians | 93.1 /100 | #122 | Exceptional 4.8% |
| Jordanians | 93.1 /100 | #123 | Exceptional 4.8% |
| Romanians | 92.5 /100 | #124 | Exceptional 4.8% |
| Immigrants | Bosnia and Herzegovina | 92.5 /100 | #125 | Exceptional 4.8% |
| Immigrants | Asia | 92.3 /100 | #126 | Exceptional 4.8% |
| Egyptians | 92.0 /100 | #127 | Exceptional 4.8% |
| Palestinians | 91.2 /100 | #128 | Exceptional 4.9% |
| Immigrants | Pakistan | 90.7 /100 | #129 | Exceptional 4.9% |
| Soviet Union | 90.7 /100 | #130 | Exceptional 4.9% |
| Immigrants | Eastern Europe | 90.5 /100 | #131 | Exceptional 4.9% |
| Puget Sound Salish | 90.4 /100 | #132 | Exceptional 4.9% |
Demographics Similar to Barbadians by Married-Couple Family Poverty
In terms of married-couple family poverty, the demographic groups most similar to Barbadians are Colville (6.3%, a difference of 0.050%), Choctaw (6.3%, a difference of 0.16%), Yaqui (6.3%, a difference of 0.62%), Indonesian (6.3%, a difference of 0.75%), and Trinidadian and Tobagonian (6.2%, a difference of 0.83%).
| Demographics | Rating | Rank | Married-Couple Family Poverty |
| Spanish Americans | 0.2 /100 | #267 | Tragic 6.2% |
| Alaska Natives | 0.2 /100 | #268 | Tragic 6.2% |
| Immigrants | West Indies | 0.1 /100 | #269 | Tragic 6.2% |
| Immigrants | Jamaica | 0.1 /100 | #270 | Tragic 6.2% |
| Immigrants | Bahamas | 0.1 /100 | #271 | Tragic 6.2% |
| Trinidadians and Tobagonians | 0.1 /100 | #272 | Tragic 6.2% |
| Colville | 0.1 /100 | #273 | Tragic 6.3% |
| Barbadians | 0.1 /100 | #274 | Tragic 6.3% |
| Choctaw | 0.1 /100 | #275 | Tragic 6.3% |
| Yaqui | 0.1 /100 | #276 | Tragic 6.3% |
| Indonesians | 0.1 /100 | #277 | Tragic 6.3% |
| Immigrants | Trinidad and Tobago | 0.1 /100 | #278 | Tragic 6.4% |
| Houma | 0.0 /100 | #279 | Tragic 6.4% |
| West Indians | 0.0 /100 | #280 | Tragic 6.4% |
| Mexican American Indians | 0.0 /100 | #281 | Tragic 6.4% |