Immigrants from Bosnia and Herzegovina vs Hispanic or Latino Married-Couple Family Poverty
COMPARE
Immigrants from Bosnia and Herzegovina
Hispanic or Latino
Married-Couple Family Poverty
Married-Couple Family Poverty Comparison
Immigrants from Bosnia and Herzegovina
Hispanics or Latinos
4.8%
MARRIED-COUPLE FAMILY POVERTY
92.5/ 100
METRIC RATING
125th/ 347
METRIC RANK
7.5%
MARRIED-COUPLE FAMILY POVERTY
0.0/ 100
METRIC RATING
327th/ 347
METRIC RANK
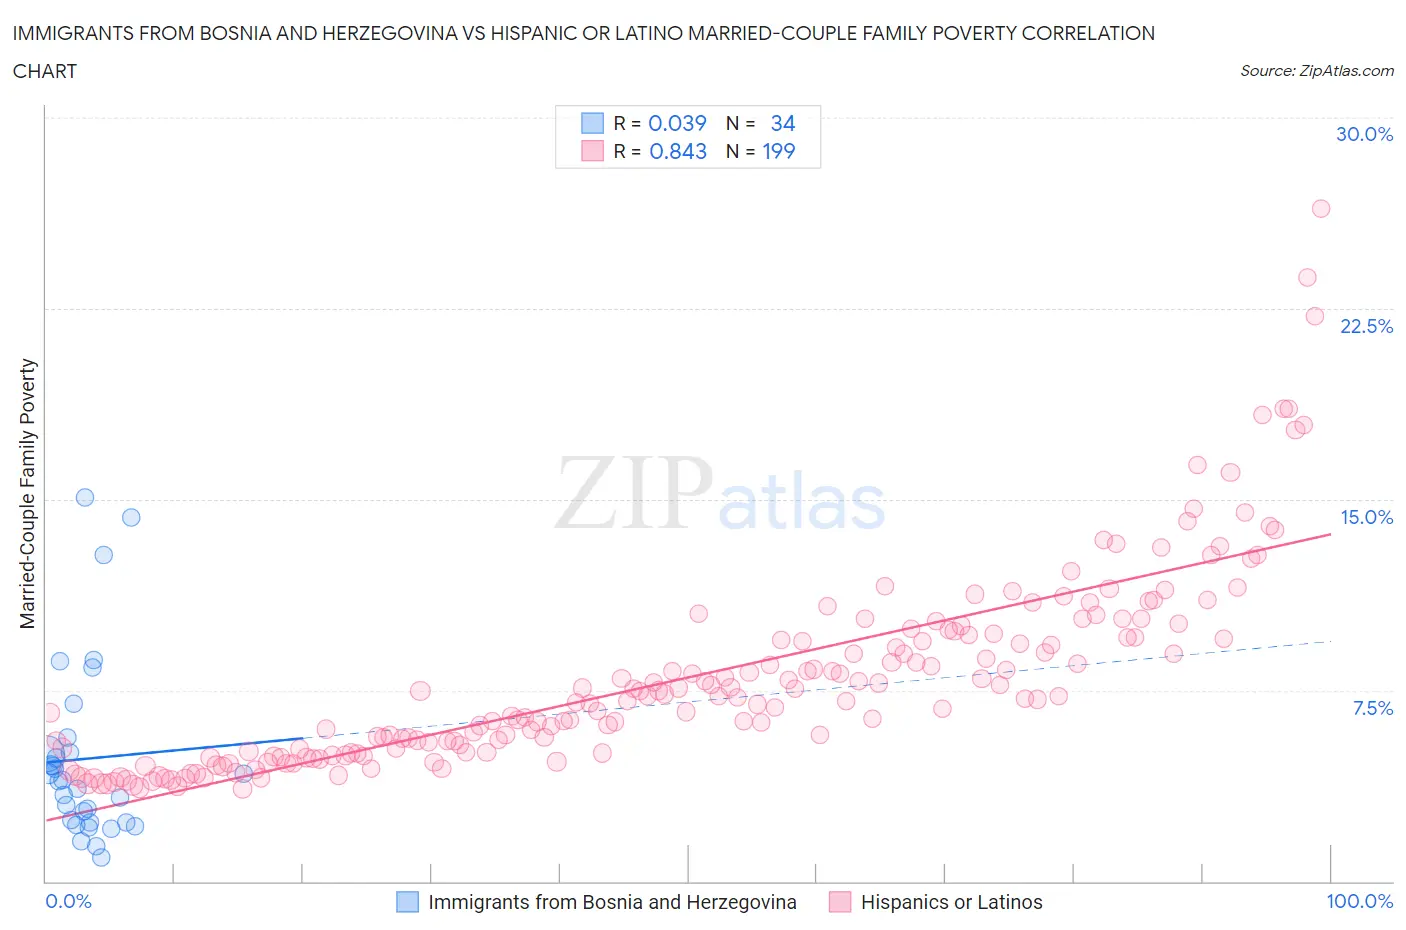
Immigrants from Bosnia and Herzegovina vs Hispanic or Latino Married-Couple Family Poverty Correlation Chart
The statistical analysis conducted on geographies consisting of 156,293,901 people shows no correlation between the proportion of Immigrants from Bosnia and Herzegovina and poverty level among married-couple families in the United States with a correlation coefficient (R) of 0.039 and weighted average of 4.8%. Similarly, the statistical analysis conducted on geographies consisting of 561,961,061 people shows a very strong positive correlation between the proportion of Hispanics or Latinos and poverty level among married-couple families in the United States with a correlation coefficient (R) of 0.843 and weighted average of 7.5%, a difference of 54.7%.
Married-Couple Family Poverty Correlation Summary
| Measurement | Immigrants from Bosnia and Herzegovina | Hispanic or Latino |
| Minimum | 0.92% | 3.6% |
| Maximum | 15.1% | 26.4% |
| Range | 14.1% | 22.8% |
| Mean | 4.8% | 8.0% |
| Median | 3.9% | 7.2% |
| Interquartile 25% (IQ1) | 2.3% | 5.1% |
| Interquartile 75% (IQ3) | 5.1% | 9.7% |
| Interquartile Range (IQR) | 2.7% | 4.6% |
| Standard Deviation (Sample) | 3.5% | 3.8% |
| Standard Deviation (Population) | 3.5% | 3.8% |
Similar Demographics by Married-Couple Family Poverty
Demographics Similar to Immigrants from Bosnia and Herzegovina by Married-Couple Family Poverty
In terms of married-couple family poverty, the demographic groups most similar to Immigrants from Bosnia and Herzegovina are Romanian (4.8%, a difference of 0.020%), Immigrants from Asia (4.8%, a difference of 0.070%), Egyptian (4.8%, a difference of 0.21%), Jordanian (4.8%, a difference of 0.29%), and White/Caucasian (4.8%, a difference of 0.30%).
| Demographics | Rating | Rank | Married-Couple Family Poverty |
| Immigrants | Philippines | 94.6 /100 | #118 | Exceptional 4.8% |
| Immigrants | Eastern Asia | 94.0 /100 | #119 | Exceptional 4.8% |
| Immigrants | Southern Europe | 93.4 /100 | #120 | Exceptional 4.8% |
| Indians (Asian) | 93.2 /100 | #121 | Exceptional 4.8% |
| Whites/Caucasians | 93.1 /100 | #122 | Exceptional 4.8% |
| Jordanians | 93.1 /100 | #123 | Exceptional 4.8% |
| Romanians | 92.5 /100 | #124 | Exceptional 4.8% |
| Immigrants | Bosnia and Herzegovina | 92.5 /100 | #125 | Exceptional 4.8% |
| Immigrants | Asia | 92.3 /100 | #126 | Exceptional 4.8% |
| Egyptians | 92.0 /100 | #127 | Exceptional 4.8% |
| Palestinians | 91.2 /100 | #128 | Exceptional 4.9% |
| Immigrants | Pakistan | 90.7 /100 | #129 | Exceptional 4.9% |
| Soviet Union | 90.7 /100 | #130 | Exceptional 4.9% |
| Immigrants | Eastern Europe | 90.5 /100 | #131 | Exceptional 4.9% |
| Puget Sound Salish | 90.4 /100 | #132 | Exceptional 4.9% |
Demographics Similar to Hispanics or Latinos by Married-Couple Family Poverty
In terms of married-couple family poverty, the demographic groups most similar to Hispanics or Latinos are Immigrants from Bangladesh (7.5%, a difference of 0.0%), Immigrants from Cuba (7.5%, a difference of 0.20%), Immigrants from Central America (7.4%, a difference of 0.73%), Vietnamese (7.4%, a difference of 0.82%), and Immigrants from Mexico (7.6%, a difference of 1.2%).
| Demographics | Rating | Rank | Married-Couple Family Poverty |
| Immigrants | Grenada | 0.0 /100 | #320 | Tragic 7.3% |
| Immigrants | Caribbean | 0.0 /100 | #321 | Tragic 7.3% |
| Immigrants | Honduras | 0.0 /100 | #322 | Tragic 7.3% |
| Vietnamese | 0.0 /100 | #323 | Tragic 7.4% |
| Immigrants | Central America | 0.0 /100 | #324 | Tragic 7.4% |
| Immigrants | Cuba | 0.0 /100 | #325 | Tragic 7.5% |
| Immigrants | Bangladesh | 0.0 /100 | #326 | Tragic 7.5% |
| Hispanics or Latinos | 0.0 /100 | #327 | Tragic 7.5% |
| Immigrants | Mexico | 0.0 /100 | #328 | Tragic 7.6% |
| Natives/Alaskans | 0.0 /100 | #329 | Tragic 8.2% |
| Paiute | 0.0 /100 | #330 | Tragic 8.3% |
| Central American Indians | 0.0 /100 | #331 | Tragic 8.3% |
| Dominicans | 0.0 /100 | #332 | Tragic 8.3% |
| Lumbee | 0.0 /100 | #333 | Tragic 8.3% |
| Immigrants | Dominican Republic | 0.0 /100 | #334 | Tragic 8.4% |