Immigrants from Belize vs Alaskan Athabascan Poverty
COMPARE
Immigrants from Belize
Alaskan Athabascan
Poverty
Poverty Comparison
Immigrants from Belize
Alaskan Athabascans
15.1%
POVERTY
0.0/ 100
METRIC RATING
289th/ 347
METRIC RANK
13.6%
POVERTY
1.5/ 100
METRIC RATING
230th/ 347
METRIC RANK
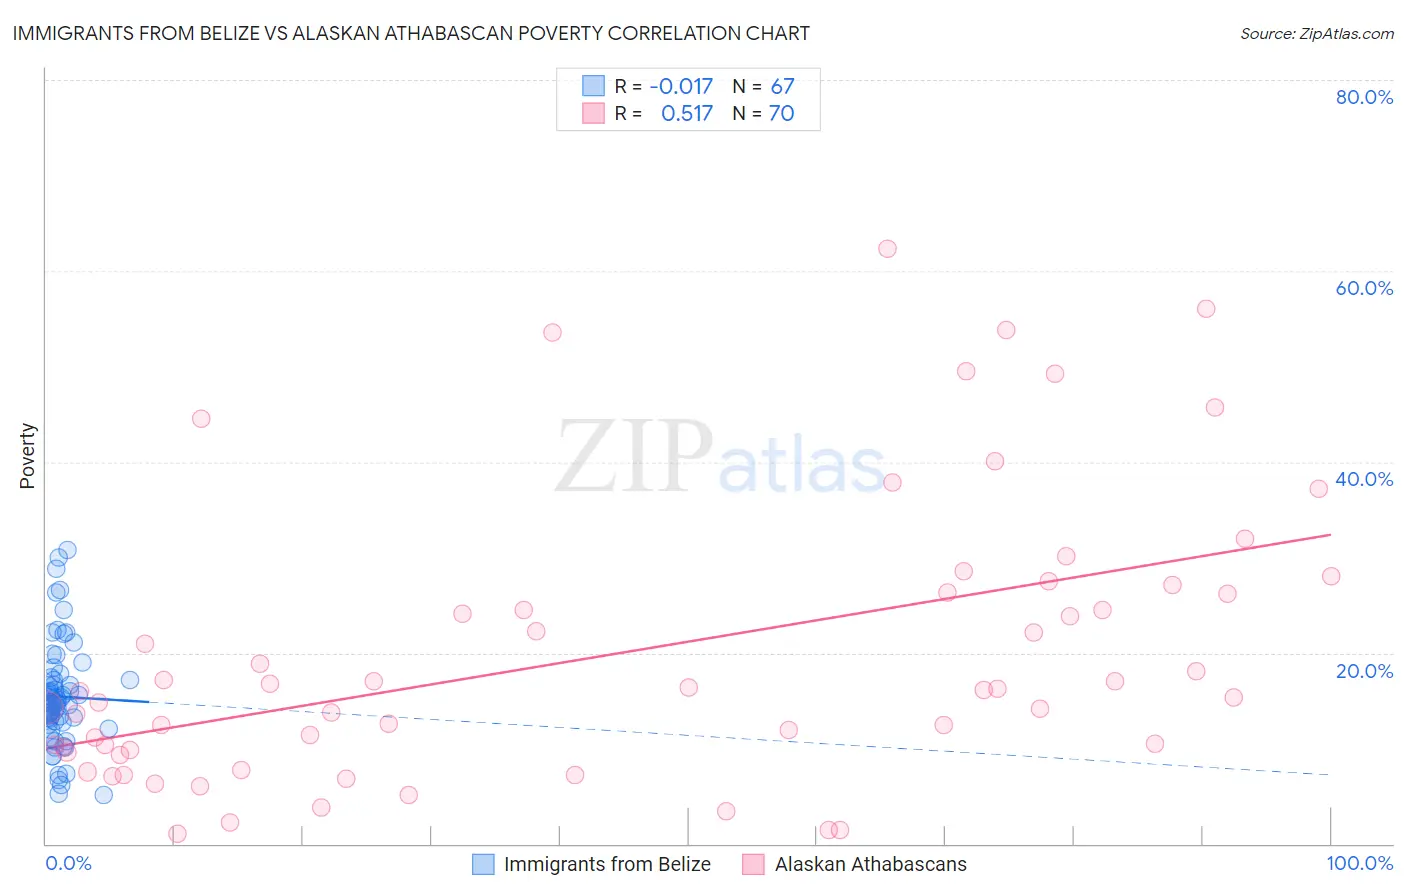
Immigrants from Belize vs Alaskan Athabascan Poverty Correlation Chart
The statistical analysis conducted on geographies consisting of 130,298,091 people shows no correlation between the proportion of Immigrants from Belize and poverty level in the United States with a correlation coefficient (R) of -0.017 and weighted average of 15.1%. Similarly, the statistical analysis conducted on geographies consisting of 45,813,239 people shows a substantial positive correlation between the proportion of Alaskan Athabascans and poverty level in the United States with a correlation coefficient (R) of 0.517 and weighted average of 13.6%, a difference of 11.2%.
Poverty Correlation Summary
| Measurement | Immigrants from Belize | Alaskan Athabascan |
| Minimum | 5.2% | 1.1% |
| Maximum | 30.8% | 62.3% |
| Range | 25.7% | 61.2% |
| Mean | 15.4% | 19.9% |
| Median | 14.8% | 16.0% |
| Interquartile 25% (IQ1) | 12.5% | 9.8% |
| Interquartile 75% (IQ3) | 17.4% | 26.3% |
| Interquartile Range (IQR) | 5.0% | 16.5% |
| Standard Deviation (Sample) | 5.6% | 14.7% |
| Standard Deviation (Population) | 5.6% | 14.6% |
Similar Demographics by Poverty
Demographics Similar to Immigrants from Belize by Poverty
In terms of poverty, the demographic groups most similar to Immigrants from Belize are Mexican (15.1%, a difference of 0.10%), Yaqui (15.1%, a difference of 0.12%), Inupiat (15.1%, a difference of 0.13%), Immigrants from Cabo Verde (15.1%, a difference of 0.23%), and Indonesian (15.1%, a difference of 0.28%).
| Demographics | Rating | Rank | Poverty |
| Comanche | 0.0 /100 | #282 | Tragic 15.0% |
| Immigrants | Haiti | 0.0 /100 | #283 | Tragic 15.0% |
| West Indians | 0.0 /100 | #284 | Tragic 15.0% |
| Vietnamese | 0.0 /100 | #285 | Tragic 15.0% |
| Immigrants | Latin America | 0.0 /100 | #286 | Tragic 15.0% |
| Inupiat | 0.0 /100 | #287 | Tragic 15.1% |
| Yaqui | 0.0 /100 | #288 | Tragic 15.1% |
| Immigrants | Belize | 0.0 /100 | #289 | Tragic 15.1% |
| Mexicans | 0.0 /100 | #290 | Tragic 15.1% |
| Immigrants | Cabo Verde | 0.0 /100 | #291 | Tragic 15.1% |
| Indonesians | 0.0 /100 | #292 | Tragic 15.1% |
| Immigrants | Zaire | 0.0 /100 | #293 | Tragic 15.1% |
| Blackfeet | 0.0 /100 | #294 | Tragic 15.2% |
| Guatemalans | 0.0 /100 | #295 | Tragic 15.3% |
| Hispanics or Latinos | 0.0 /100 | #296 | Tragic 15.3% |
Demographics Similar to Alaskan Athabascans by Poverty
In terms of poverty, the demographic groups most similar to Alaskan Athabascans are Osage (13.6%, a difference of 0.060%), Nigerian (13.6%, a difference of 0.17%), Immigrants from Nigeria (13.5%, a difference of 0.30%), Alaska Native (13.5%, a difference of 0.75%), and Marshallese (13.4%, a difference of 0.90%).
| Demographics | Rating | Rank | Poverty |
| Immigrants | Africa | 2.5 /100 | #223 | Tragic 13.4% |
| Immigrants | Eritrea | 2.4 /100 | #224 | Tragic 13.4% |
| German Russians | 2.2 /100 | #225 | Tragic 13.4% |
| Marshallese | 2.2 /100 | #226 | Tragic 13.4% |
| Alaska Natives | 2.1 /100 | #227 | Tragic 13.5% |
| Immigrants | Nigeria | 1.7 /100 | #228 | Tragic 13.5% |
| Osage | 1.5 /100 | #229 | Tragic 13.6% |
| Alaskan Athabascans | 1.5 /100 | #230 | Tragic 13.6% |
| Nigerians | 1.4 /100 | #231 | Tragic 13.6% |
| Fijians | 0.8 /100 | #232 | Tragic 13.7% |
| Immigrants | Saudi Arabia | 0.8 /100 | #233 | Tragic 13.8% |
| Immigrants | Laos | 0.7 /100 | #234 | Tragic 13.8% |
| Cubans | 0.6 /100 | #235 | Tragic 13.9% |
| Immigrants | Armenia | 0.5 /100 | #236 | Tragic 13.9% |
| French American Indians | 0.5 /100 | #237 | Tragic 13.9% |