Immigrants from Belize vs Immigrants from Europe Poverty
COMPARE
Immigrants from Belize
Immigrants from Europe
Poverty
Poverty Comparison
Immigrants from Belize
Immigrants from Europe
15.1%
POVERTY
0.0/ 100
METRIC RATING
289th/ 347
METRIC RANK
11.2%
POVERTY
98.0/ 100
METRIC RATING
59th/ 347
METRIC RANK
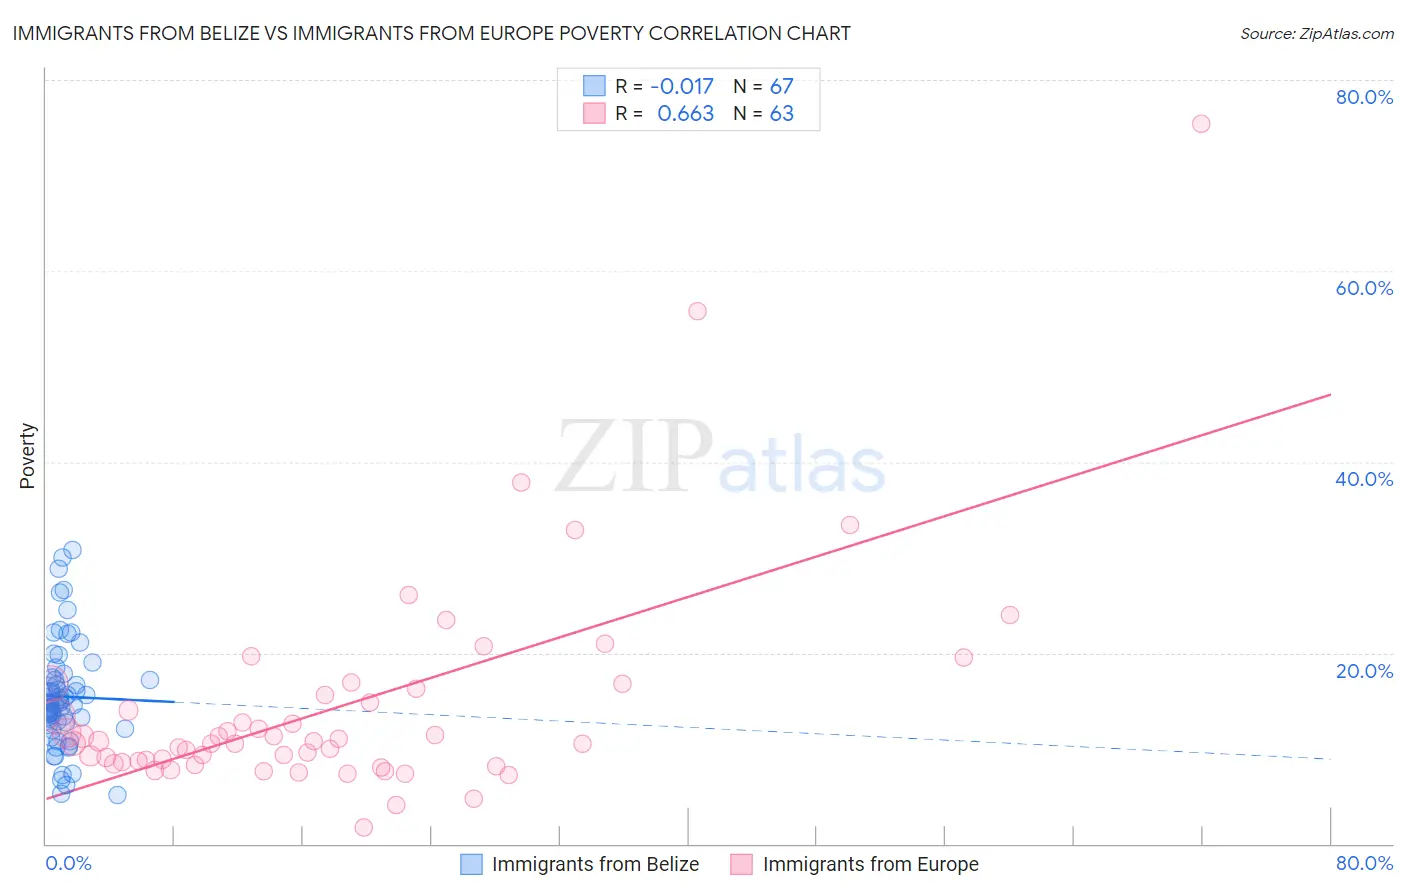
Immigrants from Belize vs Immigrants from Europe Poverty Correlation Chart
The statistical analysis conducted on geographies consisting of 130,298,091 people shows no correlation between the proportion of Immigrants from Belize and poverty level in the United States with a correlation coefficient (R) of -0.017 and weighted average of 15.1%. Similarly, the statistical analysis conducted on geographies consisting of 546,769,385 people shows a significant positive correlation between the proportion of Immigrants from Europe and poverty level in the United States with a correlation coefficient (R) of 0.663 and weighted average of 11.2%, a difference of 35.3%.
Poverty Correlation Summary
| Measurement | Immigrants from Belize | Immigrants from Europe |
| Minimum | 5.2% | 1.7% |
| Maximum | 30.8% | 75.4% |
| Range | 25.7% | 73.7% |
| Mean | 15.4% | 14.4% |
| Median | 14.8% | 10.7% |
| Interquartile 25% (IQ1) | 12.5% | 8.6% |
| Interquartile 75% (IQ3) | 17.4% | 16.3% |
| Interquartile Range (IQR) | 5.0% | 7.7% |
| Standard Deviation (Sample) | 5.6% | 11.7% |
| Standard Deviation (Population) | 5.6% | 11.6% |
Similar Demographics by Poverty
Demographics Similar to Immigrants from Belize by Poverty
In terms of poverty, the demographic groups most similar to Immigrants from Belize are Mexican (15.1%, a difference of 0.10%), Yaqui (15.1%, a difference of 0.12%), Inupiat (15.1%, a difference of 0.13%), Immigrants from Cabo Verde (15.1%, a difference of 0.23%), and Indonesian (15.1%, a difference of 0.28%).
| Demographics | Rating | Rank | Poverty |
| Comanche | 0.0 /100 | #282 | Tragic 15.0% |
| Immigrants | Haiti | 0.0 /100 | #283 | Tragic 15.0% |
| West Indians | 0.0 /100 | #284 | Tragic 15.0% |
| Vietnamese | 0.0 /100 | #285 | Tragic 15.0% |
| Immigrants | Latin America | 0.0 /100 | #286 | Tragic 15.0% |
| Inupiat | 0.0 /100 | #287 | Tragic 15.1% |
| Yaqui | 0.0 /100 | #288 | Tragic 15.1% |
| Immigrants | Belize | 0.0 /100 | #289 | Tragic 15.1% |
| Mexicans | 0.0 /100 | #290 | Tragic 15.1% |
| Immigrants | Cabo Verde | 0.0 /100 | #291 | Tragic 15.1% |
| Indonesians | 0.0 /100 | #292 | Tragic 15.1% |
| Immigrants | Zaire | 0.0 /100 | #293 | Tragic 15.1% |
| Blackfeet | 0.0 /100 | #294 | Tragic 15.2% |
| Guatemalans | 0.0 /100 | #295 | Tragic 15.3% |
| Hispanics or Latinos | 0.0 /100 | #296 | Tragic 15.3% |
Demographics Similar to Immigrants from Europe by Poverty
In terms of poverty, the demographic groups most similar to Immigrants from Europe are German (11.1%, a difference of 0.15%), Immigrants from Sri Lanka (11.2%, a difference of 0.16%), Scandinavian (11.1%, a difference of 0.21%), Immigrants from Italy (11.2%, a difference of 0.22%), and Estonian (11.1%, a difference of 0.25%).
| Demographics | Rating | Rank | Poverty |
| Immigrants | Philippines | 98.7 /100 | #52 | Exceptional 11.0% |
| Immigrants | Austria | 98.6 /100 | #53 | Exceptional 11.1% |
| Immigrants | Bulgaria | 98.5 /100 | #54 | Exceptional 11.1% |
| Immigrants | Serbia | 98.5 /100 | #55 | Exceptional 11.1% |
| Estonians | 98.2 /100 | #56 | Exceptional 11.1% |
| Scandinavians | 98.2 /100 | #57 | Exceptional 11.1% |
| Germans | 98.1 /100 | #58 | Exceptional 11.1% |
| Immigrants | Europe | 98.0 /100 | #59 | Exceptional 11.2% |
| Immigrants | Sri Lanka | 97.9 /100 | #60 | Exceptional 11.2% |
| Immigrants | Italy | 97.9 /100 | #61 | Exceptional 11.2% |
| Austrians | 97.8 /100 | #62 | Exceptional 11.2% |
| Ukrainians | 97.8 /100 | #63 | Exceptional 11.2% |
| Swiss | 97.7 /100 | #64 | Exceptional 11.2% |
| Immigrants | Asia | 97.5 /100 | #65 | Exceptional 11.2% |
| Immigrants | Netherlands | 97.5 /100 | #66 | Exceptional 11.2% |