Immigrants from Belize vs Czechoslovakian Female Unemployment
COMPARE
Immigrants from Belize
Czechoslovakian
Female Unemployment
Female Unemployment Comparison
Immigrants from Belize
Czechoslovakians
6.5%
FEMALE UNEMPLOYMENT
0.0/ 100
METRIC RATING
323rd/ 347
METRIC RANK
4.8%
FEMALE UNEMPLOYMENT
99.7/ 100
METRIC RATING
33rd/ 347
METRIC RANK
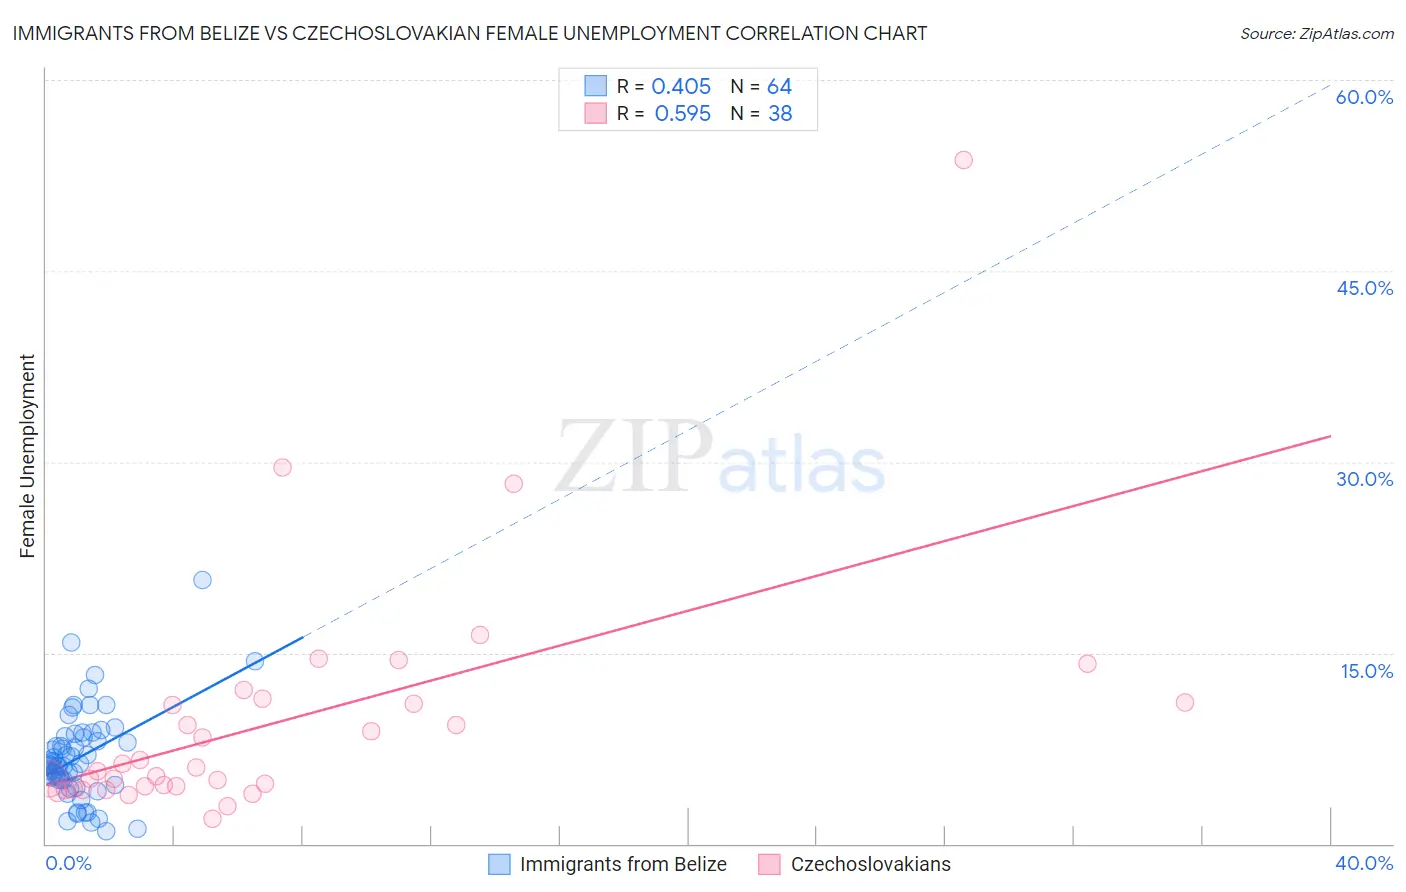
Immigrants from Belize vs Czechoslovakian Female Unemployment Correlation Chart
The statistical analysis conducted on geographies consisting of 130,161,278 people shows a moderate positive correlation between the proportion of Immigrants from Belize and unemploymnet rate among females in the United States with a correlation coefficient (R) of 0.405 and weighted average of 6.5%. Similarly, the statistical analysis conducted on geographies consisting of 365,958,591 people shows a substantial positive correlation between the proportion of Czechoslovakians and unemploymnet rate among females in the United States with a correlation coefficient (R) of 0.595 and weighted average of 4.8%, a difference of 35.8%.
Female Unemployment Correlation Summary
| Measurement | Immigrants from Belize | Czechoslovakian |
| Minimum | 1.0% | 1.9% |
| Maximum | 20.7% | 53.7% |
| Range | 19.7% | 51.8% |
| Mean | 6.8% | 9.6% |
| Median | 6.2% | 5.8% |
| Interquartile 25% (IQ1) | 5.0% | 4.5% |
| Interquartile 75% (IQ3) | 8.4% | 11.1% |
| Interquartile Range (IQR) | 3.4% | 6.6% |
| Standard Deviation (Sample) | 3.6% | 9.6% |
| Standard Deviation (Population) | 3.5% | 9.4% |
Similar Demographics by Female Unemployment
Demographics Similar to Immigrants from Belize by Female Unemployment
In terms of female unemployment, the demographic groups most similar to Immigrants from Belize are Vietnamese (6.5%, a difference of 0.10%), Black/African American (6.5%, a difference of 0.18%), Immigrants from Dominica (6.5%, a difference of 0.72%), Immigrants from Bangladesh (6.5%, a difference of 0.73%), and British West Indian (6.4%, a difference of 0.92%).
| Demographics | Rating | Rank | Female Unemployment |
| Houma | 0.0 /100 | #316 | Tragic 6.4% |
| Immigrants | St. Vincent and the Grenadines | 0.0 /100 | #317 | Tragic 6.4% |
| British West Indians | 0.0 /100 | #318 | Tragic 6.4% |
| Immigrants | Bangladesh | 0.0 /100 | #319 | Tragic 6.5% |
| Immigrants | Dominica | 0.0 /100 | #320 | Tragic 6.5% |
| Blacks/African Americans | 0.0 /100 | #321 | Tragic 6.5% |
| Vietnamese | 0.0 /100 | #322 | Tragic 6.5% |
| Immigrants | Belize | 0.0 /100 | #323 | Tragic 6.5% |
| Cheyenne | 0.0 /100 | #324 | Tragic 6.6% |
| Apache | 0.0 /100 | #325 | Tragic 6.6% |
| Natives/Alaskans | 0.0 /100 | #326 | Tragic 6.6% |
| Alaska Natives | 0.0 /100 | #327 | Tragic 6.6% |
| Guyanese | 0.0 /100 | #328 | Tragic 6.7% |
| Immigrants | Guyana | 0.0 /100 | #329 | Tragic 6.7% |
| Yakama | 0.0 /100 | #330 | Tragic 6.7% |
Demographics Similar to Czechoslovakians by Female Unemployment
In terms of female unemployment, the demographic groups most similar to Czechoslovakians are Zimbabwean (4.8%, a difference of 0.030%), French Canadian (4.8%, a difference of 0.10%), Yugoslavian (4.8%, a difference of 0.24%), Slovak (4.8%, a difference of 0.51%), and Pennsylvania German (4.8%, a difference of 0.61%).
| Demographics | Rating | Rank | Female Unemployment |
| Immigrants | Bosnia and Herzegovina | 99.9 /100 | #26 | Exceptional 4.7% |
| British | 99.9 /100 | #27 | Exceptional 4.7% |
| Irish | 99.9 /100 | #28 | Exceptional 4.7% |
| Cypriots | 99.9 /100 | #29 | Exceptional 4.7% |
| Lithuanians | 99.8 /100 | #30 | Exceptional 4.7% |
| Sudanese | 99.8 /100 | #31 | Exceptional 4.8% |
| Slovaks | 99.8 /100 | #32 | Exceptional 4.8% |
| Czechoslovakians | 99.7 /100 | #33 | Exceptional 4.8% |
| Zimbabweans | 99.7 /100 | #34 | Exceptional 4.8% |
| French Canadians | 99.7 /100 | #35 | Exceptional 4.8% |
| Yugoslavians | 99.7 /100 | #36 | Exceptional 4.8% |
| Pennsylvania Germans | 99.6 /100 | #37 | Exceptional 4.8% |
| Northern Europeans | 99.6 /100 | #38 | Exceptional 4.8% |
| Scotch-Irish | 99.6 /100 | #39 | Exceptional 4.8% |
| French | 99.6 /100 | #40 | Exceptional 4.8% |