Immigrants from Belize vs Czechoslovakian Ambulatory Disability
COMPARE
Immigrants from Belize
Czechoslovakian
Ambulatory Disability
Ambulatory Disability Comparison
Immigrants from Belize
Czechoslovakians
6.6%
AMBULATORY DISABILITY
0.4/ 100
METRIC RATING
260th/ 347
METRIC RANK
6.4%
AMBULATORY DISABILITY
3.8/ 100
METRIC RATING
229th/ 347
METRIC RANK
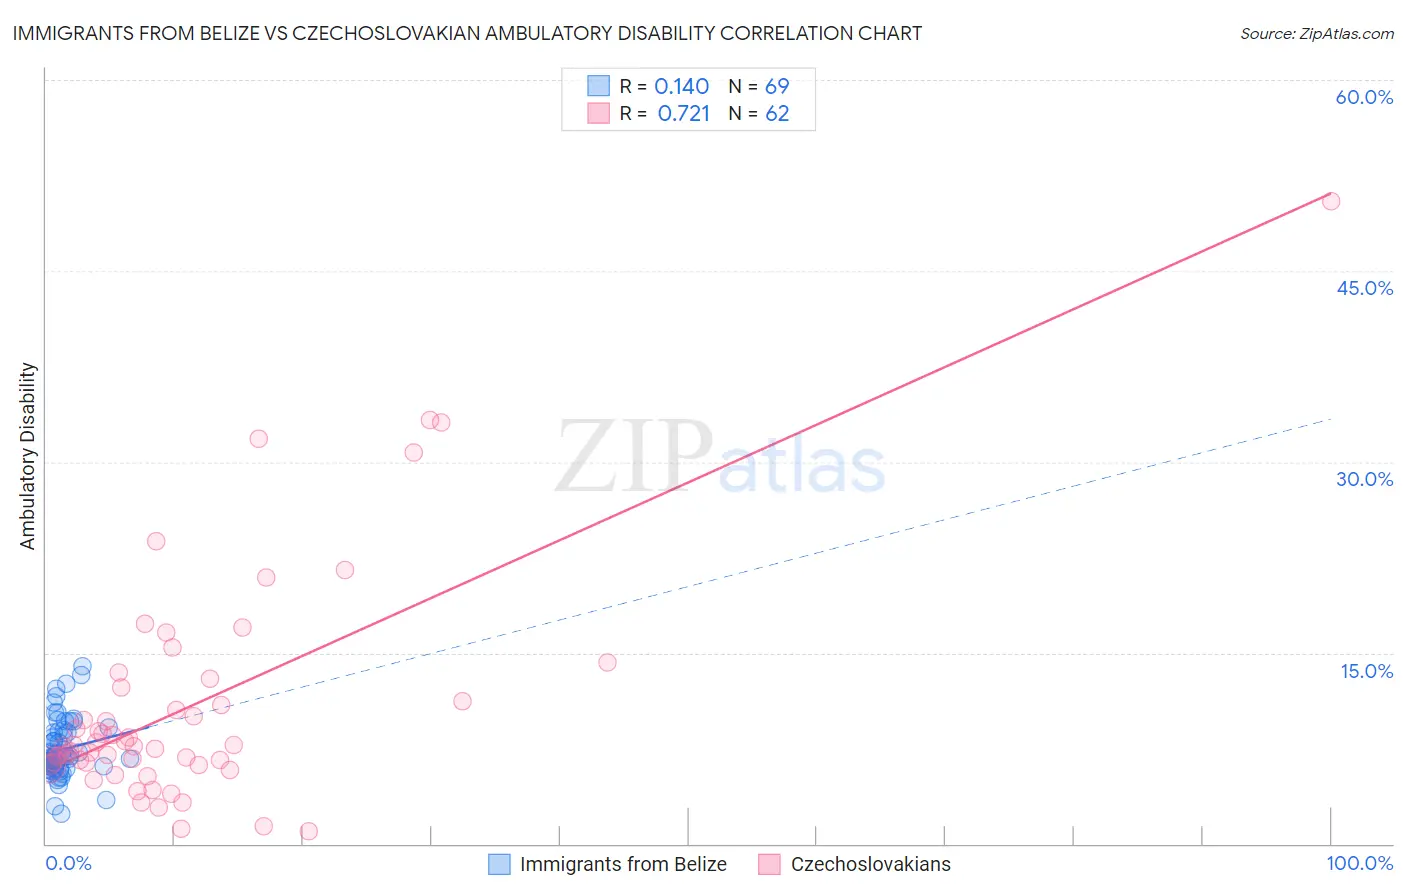
Immigrants from Belize vs Czechoslovakian Ambulatory Disability Correlation Chart
The statistical analysis conducted on geographies consisting of 130,290,767 people shows a poor positive correlation between the proportion of Immigrants from Belize and percentage of population with ambulatory disability in the United States with a correlation coefficient (R) of 0.140 and weighted average of 6.6%. Similarly, the statistical analysis conducted on geographies consisting of 368,636,980 people shows a strong positive correlation between the proportion of Czechoslovakians and percentage of population with ambulatory disability in the United States with a correlation coefficient (R) of 0.721 and weighted average of 6.4%, a difference of 2.8%.
Ambulatory Disability Correlation Summary
| Measurement | Immigrants from Belize | Czechoslovakian |
| Minimum | 2.4% | 0.94% |
| Maximum | 14.0% | 50.5% |
| Range | 11.6% | 49.6% |
| Mean | 7.4% | 10.8% |
| Median | 6.7% | 7.7% |
| Interquartile 25% (IQ1) | 6.1% | 6.3% |
| Interquartile 75% (IQ3) | 8.8% | 12.3% |
| Interquartile Range (IQR) | 2.7% | 6.0% |
| Standard Deviation (Sample) | 2.3% | 9.1% |
| Standard Deviation (Population) | 2.2% | 9.0% |
Similar Demographics by Ambulatory Disability
Demographics Similar to Immigrants from Belize by Ambulatory Disability
In terms of ambulatory disability, the demographic groups most similar to Immigrants from Belize are Aleut (6.6%, a difference of 0.010%), Irish (6.6%, a difference of 0.070%), Spanish American Indian (6.5%, a difference of 0.19%), English (6.6%, a difference of 0.24%), and Bermudan (6.5%, a difference of 0.27%).
| Demographics | Rating | Rank | Ambulatory Disability |
| Scottish | 0.7 /100 | #253 | Tragic 6.5% |
| Belizeans | 0.7 /100 | #254 | Tragic 6.5% |
| Welsh | 0.6 /100 | #255 | Tragic 6.5% |
| Immigrants | Uzbekistan | 0.6 /100 | #256 | Tragic 6.5% |
| Bermudans | 0.5 /100 | #257 | Tragic 6.5% |
| Spanish American Indians | 0.5 /100 | #258 | Tragic 6.5% |
| Aleuts | 0.4 /100 | #259 | Tragic 6.6% |
| Immigrants | Belize | 0.4 /100 | #260 | Tragic 6.6% |
| Irish | 0.4 /100 | #261 | Tragic 6.6% |
| English | 0.4 /100 | #262 | Tragic 6.6% |
| Hmong | 0.3 /100 | #263 | Tragic 6.6% |
| Nepalese | 0.2 /100 | #264 | Tragic 6.6% |
| Bahamians | 0.2 /100 | #265 | Tragic 6.6% |
| Guyanese | 0.2 /100 | #266 | Tragic 6.6% |
| Trinidadians and Tobagonians | 0.2 /100 | #267 | Tragic 6.6% |
Demographics Similar to Czechoslovakians by Ambulatory Disability
In terms of ambulatory disability, the demographic groups most similar to Czechoslovakians are Portuguese (6.4%, a difference of 0.050%), Cuban (6.4%, a difference of 0.060%), Mexican (6.4%, a difference of 0.11%), Panamanian (6.4%, a difference of 0.26%), and Slavic (6.4%, a difference of 0.39%).
| Demographics | Rating | Rank | Ambulatory Disability |
| German Russians | 9.4 /100 | #222 | Tragic 6.3% |
| Immigrants | Honduras | 7.6 /100 | #223 | Tragic 6.3% |
| Liberians | 7.1 /100 | #224 | Tragic 6.3% |
| Hondurans | 6.3 /100 | #225 | Tragic 6.3% |
| Slavs | 5.1 /100 | #226 | Tragic 6.4% |
| Cubans | 4.0 /100 | #227 | Tragic 6.4% |
| Portuguese | 4.0 /100 | #228 | Tragic 6.4% |
| Czechoslovakians | 3.8 /100 | #229 | Tragic 6.4% |
| Mexicans | 3.5 /100 | #230 | Tragic 6.4% |
| Panamanians | 3.1 /100 | #231 | Tragic 6.4% |
| Assyrians/Chaldeans/Syriacs | 2.4 /100 | #232 | Tragic 6.4% |
| Sub-Saharan Africans | 2.3 /100 | #233 | Tragic 6.4% |
| Immigrants | Liberia | 2.3 /100 | #234 | Tragic 6.4% |
| Hispanics or Latinos | 2.2 /100 | #235 | Tragic 6.4% |
| Dutch | 2.0 /100 | #236 | Tragic 6.4% |