Immigrants from Belize vs Czechoslovakian Median Household Income
COMPARE
Immigrants from Belize
Czechoslovakian
Median Household Income
Median Household Income Comparison
Immigrants from Belize
Czechoslovakians
$75,938
MEDIAN HOUSEHOLD INCOME
0.3/ 100
METRIC RATING
265th/ 347
METRIC RANK
$84,965
MEDIAN HOUSEHOLD INCOME
47.8/ 100
METRIC RATING
178th/ 347
METRIC RANK
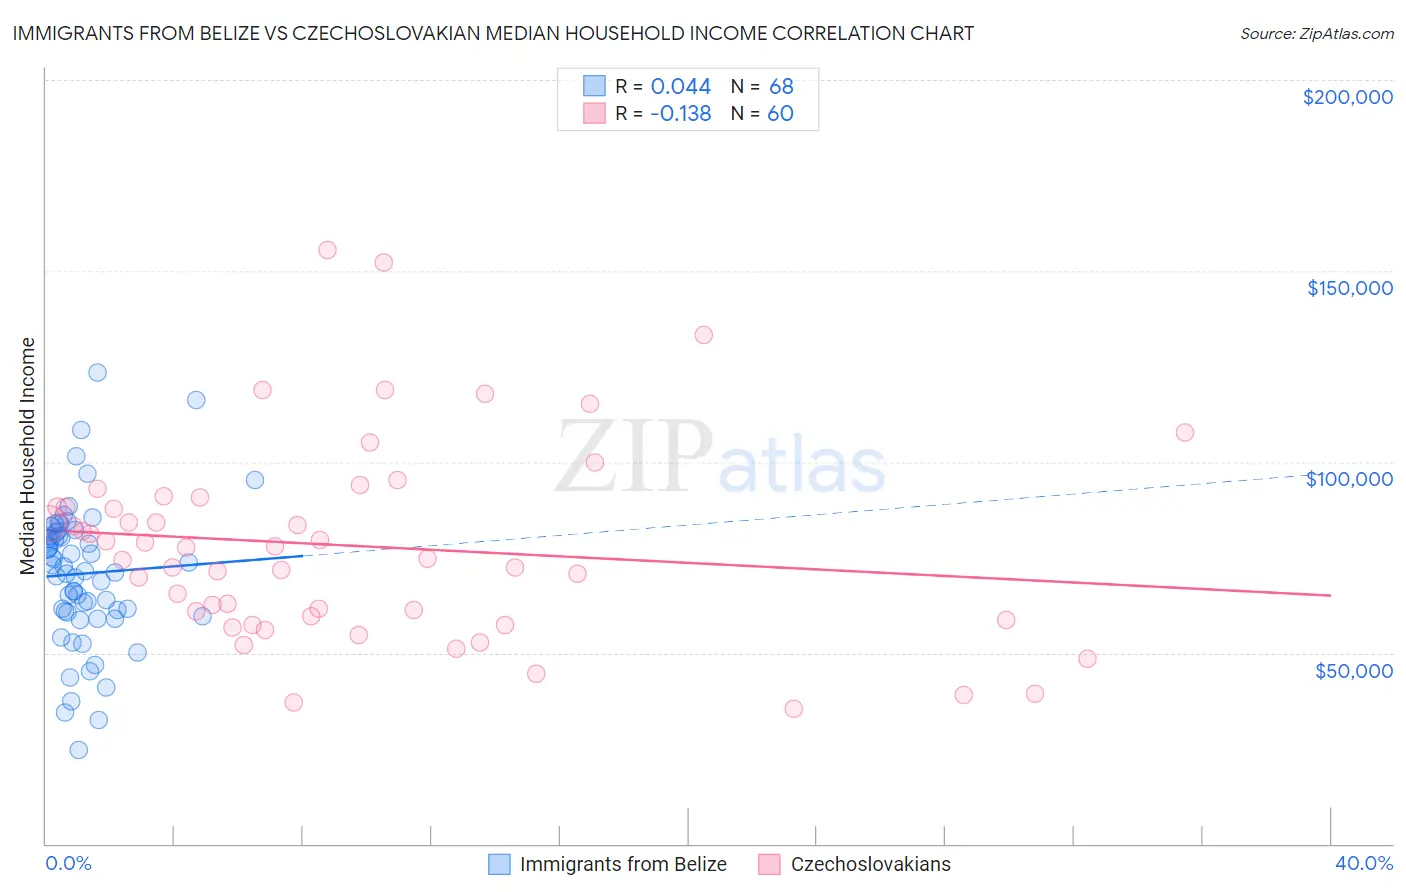
Immigrants from Belize vs Czechoslovakian Median Household Income Correlation Chart
The statistical analysis conducted on geographies consisting of 130,279,222 people shows no correlation between the proportion of Immigrants from Belize and median household income in the United States with a correlation coefficient (R) of 0.044 and weighted average of $75,938. Similarly, the statistical analysis conducted on geographies consisting of 368,473,547 people shows a poor negative correlation between the proportion of Czechoslovakians and median household income in the United States with a correlation coefficient (R) of -0.138 and weighted average of $84,965, a difference of 11.9%.
Median Household Income Correlation Summary
| Measurement | Immigrants from Belize | Czechoslovakian |
| Minimum | $24,491 | $35,250 |
| Maximum | $123,457 | $155,633 |
| Range | $98,966 | $120,383 |
| Mean | $70,734 | $77,955 |
| Median | $72,073 | $76,068 |
| Interquartile 25% (IQ1) | $60,781 | $59,148 |
| Interquartile 75% (IQ3) | $80,909 | $89,491 |
| Interquartile Range (IQR) | $20,129 | $30,343 |
| Standard Deviation (Sample) | $18,493 | $26,040 |
| Standard Deviation (Population) | $18,357 | $25,822 |
Similar Demographics by Median Household Income
Demographics Similar to Immigrants from Belize by Median Household Income
In terms of median household income, the demographic groups most similar to Immigrants from Belize are American ($75,932, a difference of 0.010%), Guatemalan ($75,961, a difference of 0.030%), German Russian ($75,856, a difference of 0.11%), Immigrants from Jamaica ($75,851, a difference of 0.11%), and Cape Verdean ($75,848, a difference of 0.12%).
| Demographics | Rating | Rank | Median Household Income |
| Immigrants | Nicaragua | 0.5 /100 | #258 | Tragic $76,784 |
| Spanish American Indians | 0.4 /100 | #259 | Tragic $76,670 |
| Jamaicans | 0.4 /100 | #260 | Tragic $76,583 |
| Immigrants | Grenada | 0.4 /100 | #261 | Tragic $76,517 |
| French American Indians | 0.4 /100 | #262 | Tragic $76,387 |
| Alaskan Athabascans | 0.4 /100 | #263 | Tragic $76,383 |
| Guatemalans | 0.3 /100 | #264 | Tragic $75,961 |
| Immigrants | Belize | 0.3 /100 | #265 | Tragic $75,938 |
| Americans | 0.3 /100 | #266 | Tragic $75,932 |
| German Russians | 0.3 /100 | #267 | Tragic $75,856 |
| Immigrants | Jamaica | 0.3 /100 | #268 | Tragic $75,851 |
| Cape Verdeans | 0.3 /100 | #269 | Tragic $75,848 |
| Hmong | 0.3 /100 | #270 | Tragic $75,839 |
| Pennsylvania Germans | 0.3 /100 | #271 | Tragic $75,814 |
| Somalis | 0.3 /100 | #272 | Tragic $75,782 |
Demographics Similar to Czechoslovakians by Median Household Income
In terms of median household income, the demographic groups most similar to Czechoslovakians are English ($84,915, a difference of 0.060%), Immigrants from Eritrea ($85,025, a difference of 0.070%), Immigrants from Costa Rica ($85,054, a difference of 0.10%), Alsatian ($85,053, a difference of 0.10%), and Scottish ($85,101, a difference of 0.16%).
| Demographics | Rating | Rank | Median Household Income |
| Immigrants | South America | 58.1 /100 | #171 | Average $85,611 |
| Slovenes | 57.4 /100 | #172 | Average $85,562 |
| Immigrants | Cameroon | 53.4 /100 | #173 | Average $85,314 |
| Scottish | 50.0 /100 | #174 | Average $85,101 |
| Immigrants | Costa Rica | 49.2 /100 | #175 | Average $85,054 |
| Alsatians | 49.2 /100 | #176 | Average $85,053 |
| Immigrants | Eritrea | 48.8 /100 | #177 | Average $85,025 |
| Czechoslovakians | 47.8 /100 | #178 | Average $84,965 |
| English | 47.0 /100 | #179 | Average $84,915 |
| Immigrants | Portugal | 44.2 /100 | #180 | Average $84,740 |
| Hawaiians | 44.1 /100 | #181 | Average $84,729 |
| Uruguayans | 43.5 /100 | #182 | Average $84,691 |
| Spaniards | 42.7 /100 | #183 | Average $84,644 |
| Immigrants | Eastern Africa | 37.4 /100 | #184 | Fair $84,299 |
| Kenyans | 34.2 /100 | #185 | Fair $84,085 |