Immigrants from Belize vs Brazilian Poverty
COMPARE
Immigrants from Belize
Brazilian
Poverty
Poverty Comparison
Immigrants from Belize
Brazilians
15.1%
POVERTY
0.0/ 100
METRIC RATING
289th/ 347
METRIC RANK
11.9%
POVERTY
79.7/ 100
METRIC RATING
143rd/ 347
METRIC RANK
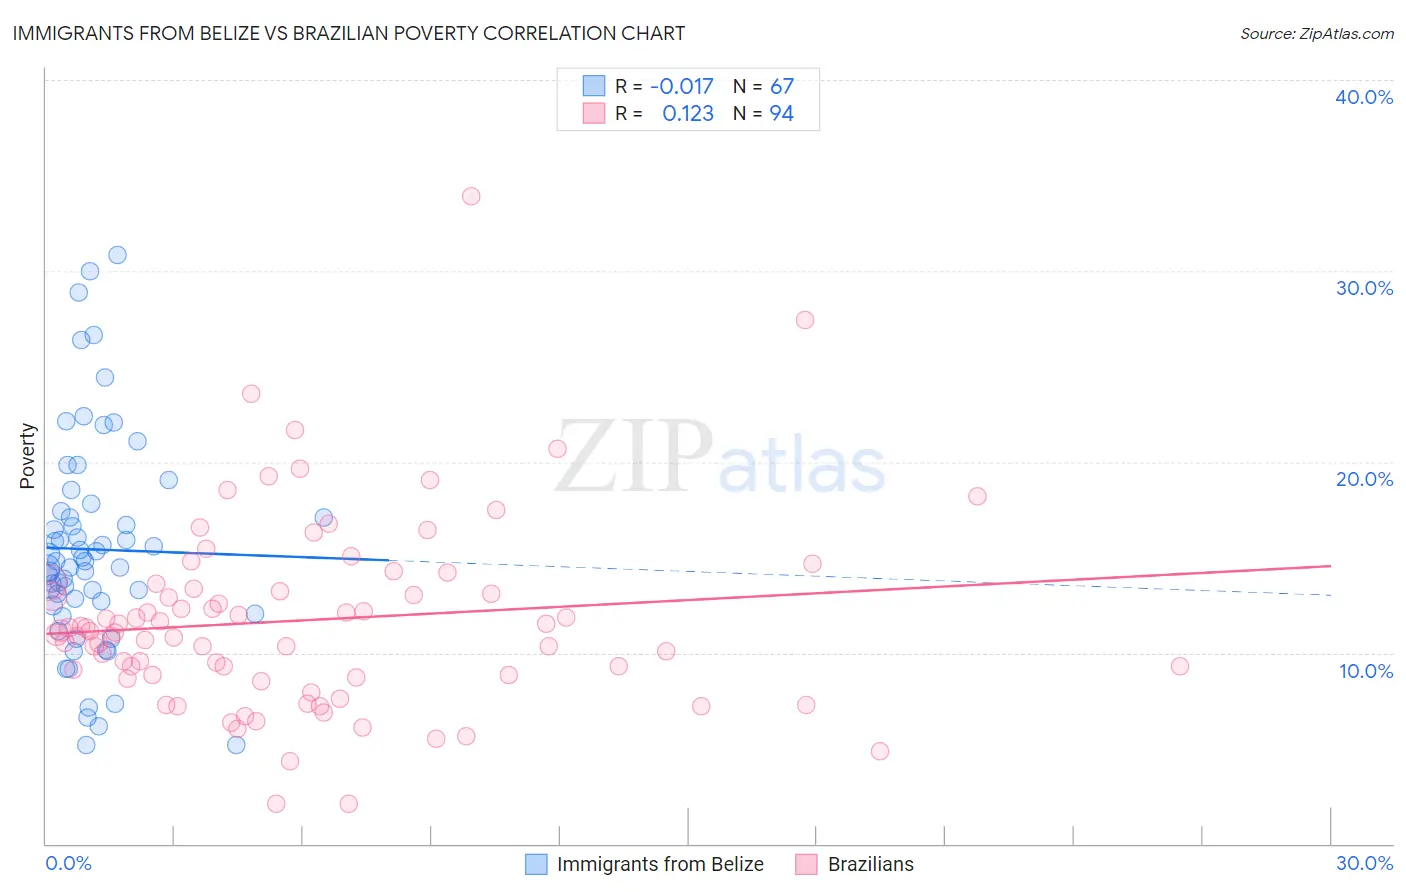
Immigrants from Belize vs Brazilian Poverty Correlation Chart
The statistical analysis conducted on geographies consisting of 130,298,091 people shows no correlation between the proportion of Immigrants from Belize and poverty level in the United States with a correlation coefficient (R) of -0.017 and weighted average of 15.1%. Similarly, the statistical analysis conducted on geographies consisting of 323,736,461 people shows a poor positive correlation between the proportion of Brazilians and poverty level in the United States with a correlation coefficient (R) of 0.123 and weighted average of 11.9%, a difference of 26.7%.
Poverty Correlation Summary
| Measurement | Immigrants from Belize | Brazilian |
| Minimum | 5.2% | 2.1% |
| Maximum | 30.8% | 33.9% |
| Range | 25.7% | 31.8% |
| Mean | 15.4% | 11.7% |
| Median | 14.8% | 11.1% |
| Interquartile 25% (IQ1) | 12.5% | 8.8% |
| Interquartile 75% (IQ3) | 17.4% | 13.3% |
| Interquartile Range (IQR) | 5.0% | 4.5% |
| Standard Deviation (Sample) | 5.6% | 5.0% |
| Standard Deviation (Population) | 5.6% | 5.0% |
Similar Demographics by Poverty
Demographics Similar to Immigrants from Belize by Poverty
In terms of poverty, the demographic groups most similar to Immigrants from Belize are Mexican (15.1%, a difference of 0.10%), Yaqui (15.1%, a difference of 0.12%), Inupiat (15.1%, a difference of 0.13%), Immigrants from Cabo Verde (15.1%, a difference of 0.23%), and Indonesian (15.1%, a difference of 0.28%).
| Demographics | Rating | Rank | Poverty |
| Comanche | 0.0 /100 | #282 | Tragic 15.0% |
| Immigrants | Haiti | 0.0 /100 | #283 | Tragic 15.0% |
| West Indians | 0.0 /100 | #284 | Tragic 15.0% |
| Vietnamese | 0.0 /100 | #285 | Tragic 15.0% |
| Immigrants | Latin America | 0.0 /100 | #286 | Tragic 15.0% |
| Inupiat | 0.0 /100 | #287 | Tragic 15.1% |
| Yaqui | 0.0 /100 | #288 | Tragic 15.1% |
| Immigrants | Belize | 0.0 /100 | #289 | Tragic 15.1% |
| Mexicans | 0.0 /100 | #290 | Tragic 15.1% |
| Immigrants | Cabo Verde | 0.0 /100 | #291 | Tragic 15.1% |
| Indonesians | 0.0 /100 | #292 | Tragic 15.1% |
| Immigrants | Zaire | 0.0 /100 | #293 | Tragic 15.1% |
| Blackfeet | 0.0 /100 | #294 | Tragic 15.2% |
| Guatemalans | 0.0 /100 | #295 | Tragic 15.3% |
| Hispanics or Latinos | 0.0 /100 | #296 | Tragic 15.3% |
Demographics Similar to Brazilians by Poverty
In terms of poverty, the demographic groups most similar to Brazilians are Basque (11.9%, a difference of 0.11%), Immigrants from France (11.9%, a difference of 0.12%), Immigrants from Peru (11.9%, a difference of 0.22%), Icelander (11.9%, a difference of 0.27%), and Pakistani (11.9%, a difference of 0.41%).
| Demographics | Rating | Rank | Poverty |
| Chileans | 84.2 /100 | #136 | Excellent 11.8% |
| Immigrants | Switzerland | 83.0 /100 | #137 | Excellent 11.8% |
| Immigrants | Jordan | 82.4 /100 | #138 | Excellent 11.9% |
| Pakistanis | 82.2 /100 | #139 | Excellent 11.9% |
| Immigrants | Peru | 81.1 /100 | #140 | Excellent 11.9% |
| Immigrants | France | 80.5 /100 | #141 | Excellent 11.9% |
| Basques | 80.4 /100 | #142 | Excellent 11.9% |
| Brazilians | 79.7 /100 | #143 | Good 11.9% |
| Icelanders | 77.9 /100 | #144 | Good 11.9% |
| Syrians | 75.1 /100 | #145 | Good 12.0% |
| Afghans | 74.9 /100 | #146 | Good 12.0% |
| Immigrants | Bosnia and Herzegovina | 73.7 /100 | #147 | Good 12.0% |
| Immigrants | Germany | 72.7 /100 | #148 | Good 12.0% |
| Immigrants | Malaysia | 72.7 /100 | #149 | Good 12.0% |
| Immigrants | Kazakhstan | 72.3 /100 | #150 | Good 12.0% |