Immigrants from Belize vs Cheyenne Poverty
COMPARE
Immigrants from Belize
Cheyenne
Poverty
Poverty Comparison
Immigrants from Belize
Cheyenne
15.1%
POVERTY
0.0/ 100
METRIC RATING
289th/ 347
METRIC RANK
18.9%
POVERTY
0.0/ 100
METRIC RATING
335th/ 347
METRIC RANK
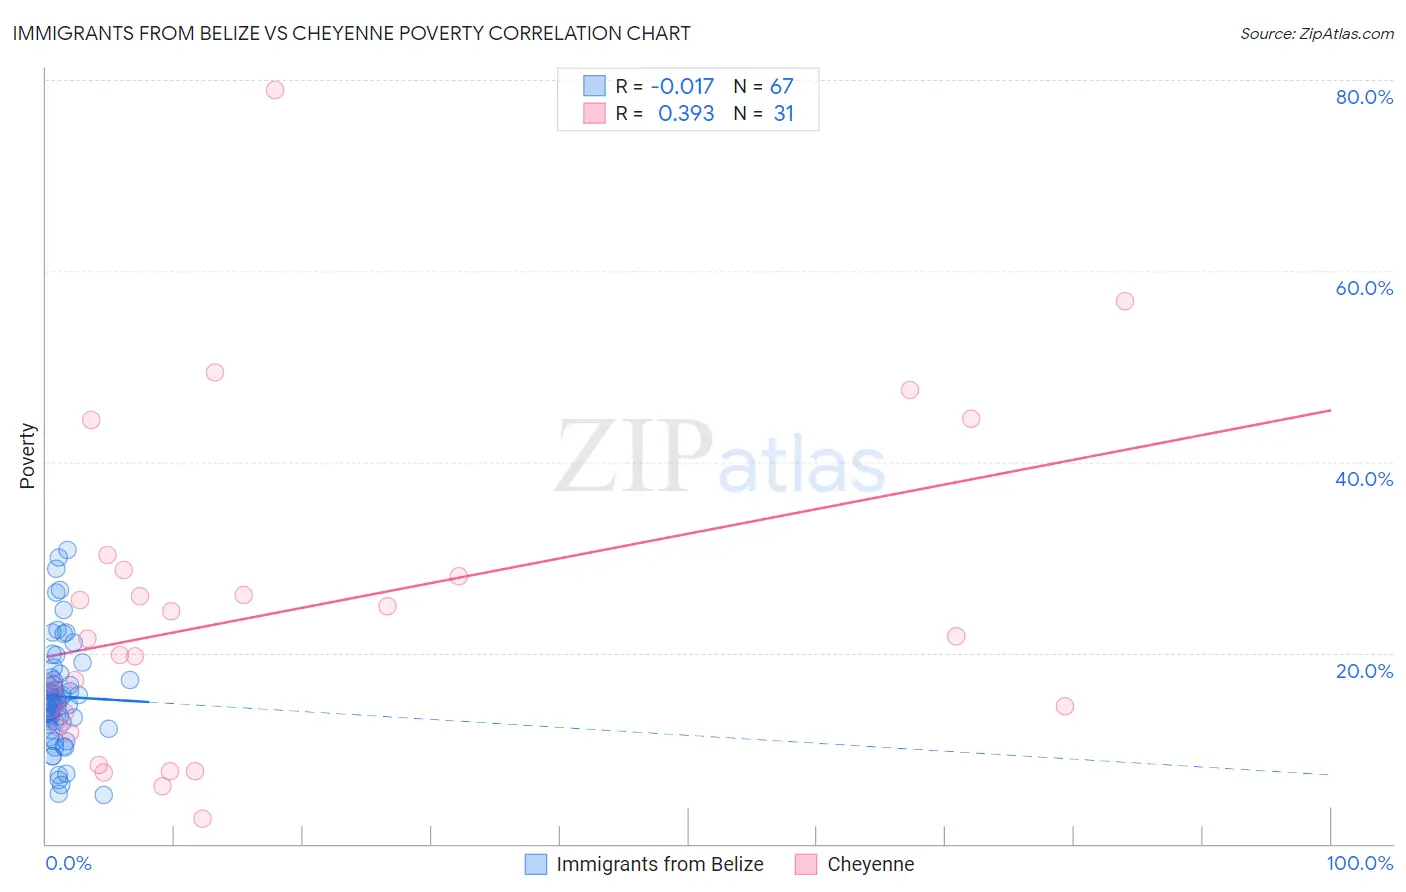
Immigrants from Belize vs Cheyenne Poverty Correlation Chart
The statistical analysis conducted on geographies consisting of 130,298,091 people shows no correlation between the proportion of Immigrants from Belize and poverty level in the United States with a correlation coefficient (R) of -0.017 and weighted average of 15.1%. Similarly, the statistical analysis conducted on geographies consisting of 80,711,437 people shows a mild positive correlation between the proportion of Cheyenne and poverty level in the United States with a correlation coefficient (R) of 0.393 and weighted average of 18.9%, a difference of 25.5%.
Poverty Correlation Summary
| Measurement | Immigrants from Belize | Cheyenne |
| Minimum | 5.2% | 2.7% |
| Maximum | 30.8% | 78.9% |
| Range | 25.7% | 76.3% |
| Mean | 15.4% | 24.5% |
| Median | 14.8% | 21.4% |
| Interquartile 25% (IQ1) | 12.5% | 12.2% |
| Interquartile 75% (IQ3) | 17.4% | 28.6% |
| Interquartile Range (IQR) | 5.0% | 16.5% |
| Standard Deviation (Sample) | 5.6% | 17.1% |
| Standard Deviation (Population) | 5.6% | 16.8% |
Similar Demographics by Poverty
Demographics Similar to Immigrants from Belize by Poverty
In terms of poverty, the demographic groups most similar to Immigrants from Belize are Mexican (15.1%, a difference of 0.10%), Yaqui (15.1%, a difference of 0.12%), Inupiat (15.1%, a difference of 0.13%), Immigrants from Cabo Verde (15.1%, a difference of 0.23%), and Indonesian (15.1%, a difference of 0.28%).
| Demographics | Rating | Rank | Poverty |
| Comanche | 0.0 /100 | #282 | Tragic 15.0% |
| Immigrants | Haiti | 0.0 /100 | #283 | Tragic 15.0% |
| West Indians | 0.0 /100 | #284 | Tragic 15.0% |
| Vietnamese | 0.0 /100 | #285 | Tragic 15.0% |
| Immigrants | Latin America | 0.0 /100 | #286 | Tragic 15.0% |
| Inupiat | 0.0 /100 | #287 | Tragic 15.1% |
| Yaqui | 0.0 /100 | #288 | Tragic 15.1% |
| Immigrants | Belize | 0.0 /100 | #289 | Tragic 15.1% |
| Mexicans | 0.0 /100 | #290 | Tragic 15.1% |
| Immigrants | Cabo Verde | 0.0 /100 | #291 | Tragic 15.1% |
| Indonesians | 0.0 /100 | #292 | Tragic 15.1% |
| Immigrants | Zaire | 0.0 /100 | #293 | Tragic 15.1% |
| Blackfeet | 0.0 /100 | #294 | Tragic 15.2% |
| Guatemalans | 0.0 /100 | #295 | Tragic 15.3% |
| Hispanics or Latinos | 0.0 /100 | #296 | Tragic 15.3% |
Demographics Similar to Cheyenne by Poverty
In terms of poverty, the demographic groups most similar to Cheyenne are Pueblo (19.4%, a difference of 2.5%), Apache (18.4%, a difference of 2.8%), Houma (18.4%, a difference of 2.8%), Sioux (19.8%, a difference of 4.4%), and Native/Alaskan (18.1%, a difference of 4.9%).
| Demographics | Rating | Rank | Poverty |
| Ute | 0.0 /100 | #328 | Tragic 16.9% |
| Blacks/African Americans | 0.0 /100 | #329 | Tragic 17.3% |
| Dominicans | 0.0 /100 | #330 | Tragic 17.6% |
| Immigrants | Dominican Republic | 0.0 /100 | #331 | Tragic 17.8% |
| Natives/Alaskans | 0.0 /100 | #332 | Tragic 18.1% |
| Houma | 0.0 /100 | #333 | Tragic 18.4% |
| Apache | 0.0 /100 | #334 | Tragic 18.4% |
| Cheyenne | 0.0 /100 | #335 | Tragic 18.9% |
| Pueblo | 0.0 /100 | #336 | Tragic 19.4% |
| Sioux | 0.0 /100 | #337 | Tragic 19.8% |
| Yuman | 0.0 /100 | #338 | Tragic 20.2% |
| Crow | 0.0 /100 | #339 | Tragic 20.7% |
| Yup'ik | 0.0 /100 | #340 | Tragic 20.8% |
| Hopi | 0.0 /100 | #341 | Tragic 20.8% |
| Immigrants | Yemen | 0.0 /100 | #342 | Tragic 21.5% |