Immigrants from Belize vs Choctaw Poverty
COMPARE
Immigrants from Belize
Choctaw
Poverty
Poverty Comparison
Immigrants from Belize
Choctaw
15.1%
POVERTY
0.0/ 100
METRIC RATING
289th/ 347
METRIC RANK
15.6%
POVERTY
0.0/ 100
METRIC RATING
308th/ 347
METRIC RANK
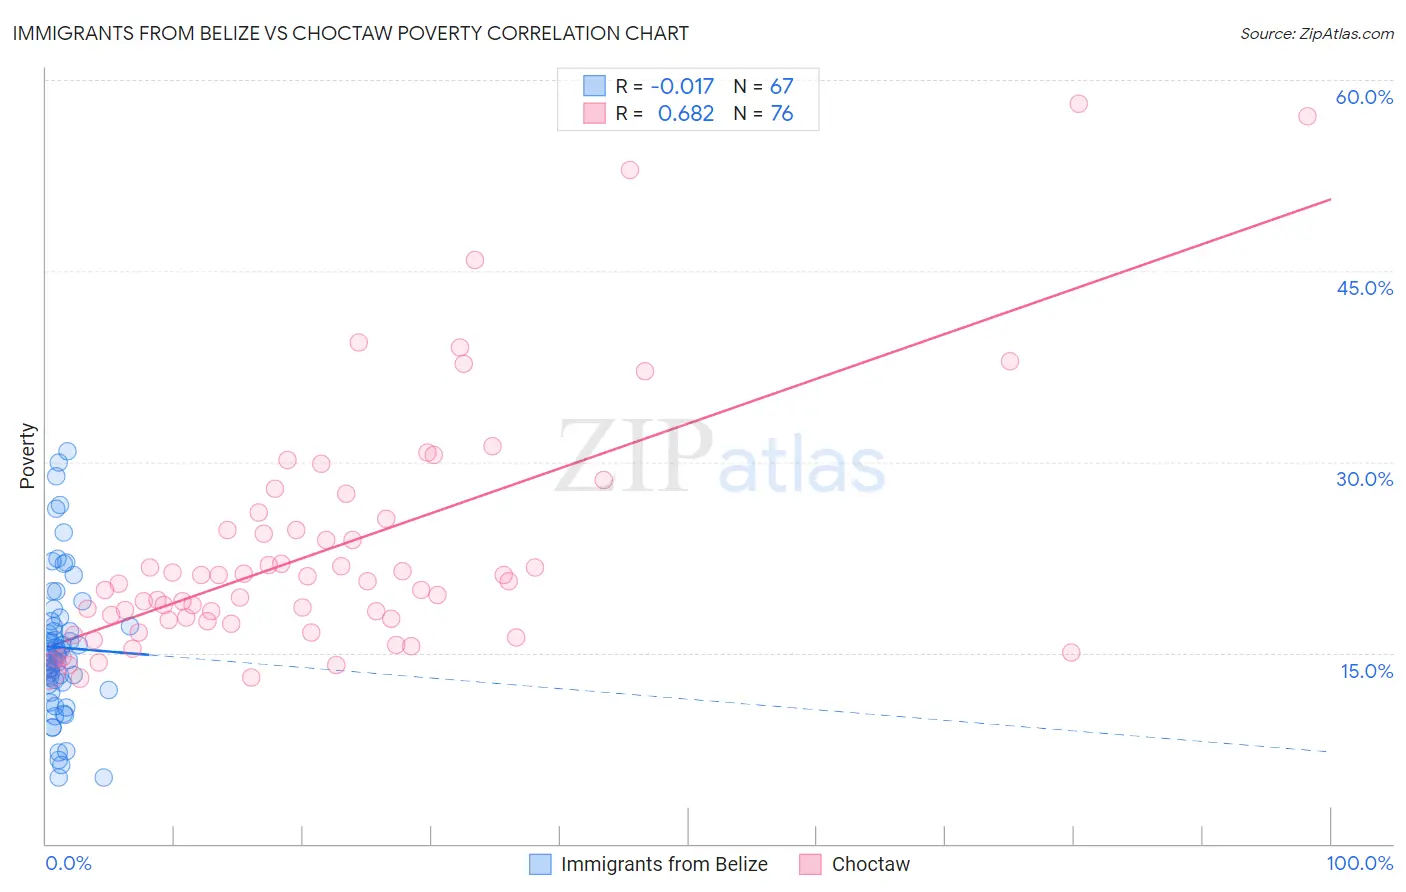
Immigrants from Belize vs Choctaw Poverty Correlation Chart
The statistical analysis conducted on geographies consisting of 130,298,091 people shows no correlation between the proportion of Immigrants from Belize and poverty level in the United States with a correlation coefficient (R) of -0.017 and weighted average of 15.1%. Similarly, the statistical analysis conducted on geographies consisting of 269,626,558 people shows a significant positive correlation between the proportion of Choctaw and poverty level in the United States with a correlation coefficient (R) of 0.682 and weighted average of 15.6%, a difference of 3.4%.
Poverty Correlation Summary
| Measurement | Immigrants from Belize | Choctaw |
| Minimum | 5.2% | 13.0% |
| Maximum | 30.8% | 58.1% |
| Range | 25.7% | 45.1% |
| Mean | 15.4% | 23.1% |
| Median | 14.8% | 20.5% |
| Interquartile 25% (IQ1) | 12.5% | 17.5% |
| Interquartile 75% (IQ3) | 17.4% | 25.1% |
| Interquartile Range (IQR) | 5.0% | 7.6% |
| Standard Deviation (Sample) | 5.6% | 9.6% |
| Standard Deviation (Population) | 5.6% | 9.6% |
Demographics Similar to Immigrants from Belize and Choctaw by Poverty
In terms of poverty, the demographic groups most similar to Immigrants from Belize are Mexican (15.1%, a difference of 0.10%), Yaqui (15.1%, a difference of 0.12%), Immigrants from Cabo Verde (15.1%, a difference of 0.23%), Indonesian (15.1%, a difference of 0.28%), and Immigrants from Zaire (15.1%, a difference of 0.29%). Similarly, the demographic groups most similar to Choctaw are African (15.6%, a difference of 0.11%), Creek (15.6%, a difference of 0.18%), Immigrants from Guatemala (15.5%, a difference of 0.62%), Immigrants from Mexico (15.5%, a difference of 0.66%), and Immigrants from Caribbean (15.5%, a difference of 0.75%).
| Demographics | Rating | Rank | Poverty |
| Yaqui | 0.0 /100 | #288 | Tragic 15.1% |
| Immigrants | Belize | 0.0 /100 | #289 | Tragic 15.1% |
| Mexicans | 0.0 /100 | #290 | Tragic 15.1% |
| Immigrants | Cabo Verde | 0.0 /100 | #291 | Tragic 15.1% |
| Indonesians | 0.0 /100 | #292 | Tragic 15.1% |
| Immigrants | Zaire | 0.0 /100 | #293 | Tragic 15.1% |
| Blackfeet | 0.0 /100 | #294 | Tragic 15.2% |
| Guatemalans | 0.0 /100 | #295 | Tragic 15.3% |
| Hispanics or Latinos | 0.0 /100 | #296 | Tragic 15.3% |
| Immigrants | Bangladesh | 0.0 /100 | #297 | Tragic 15.3% |
| Immigrants | Senegal | 0.0 /100 | #298 | Tragic 15.3% |
| Senegalese | 0.0 /100 | #299 | Tragic 15.3% |
| Immigrants | Central America | 0.0 /100 | #300 | Tragic 15.4% |
| Bahamians | 0.0 /100 | #301 | Tragic 15.4% |
| Somalis | 0.0 /100 | #302 | Tragic 15.4% |
| Immigrants | Caribbean | 0.0 /100 | #303 | Tragic 15.5% |
| Immigrants | Mexico | 0.0 /100 | #304 | Tragic 15.5% |
| Immigrants | Guatemala | 0.0 /100 | #305 | Tragic 15.5% |
| Creek | 0.0 /100 | #306 | Tragic 15.6% |
| Africans | 0.0 /100 | #307 | Tragic 15.6% |
| Choctaw | 0.0 /100 | #308 | Tragic 15.6% |