Immigrants from Belize vs Korean Poverty
COMPARE
Immigrants from Belize
Korean
Poverty
Poverty Comparison
Immigrants from Belize
Koreans
15.1%
POVERTY
0.0/ 100
METRIC RATING
289th/ 347
METRIC RANK
10.9%
POVERTY
99.2/ 100
METRIC RATING
42nd/ 347
METRIC RANK
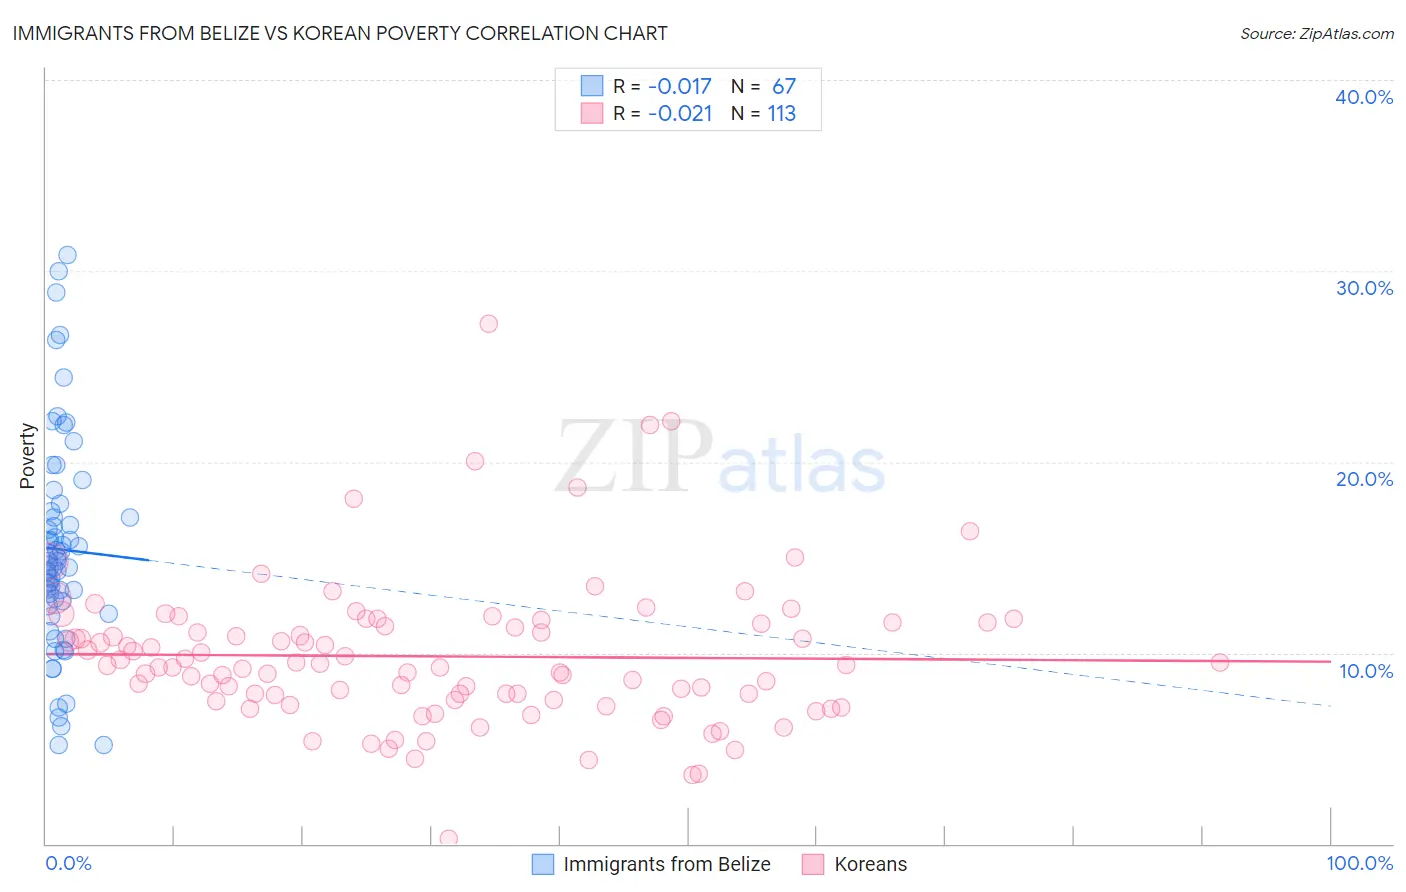
Immigrants from Belize vs Korean Poverty Correlation Chart
The statistical analysis conducted on geographies consisting of 130,298,091 people shows no correlation between the proportion of Immigrants from Belize and poverty level in the United States with a correlation coefficient (R) of -0.017 and weighted average of 15.1%. Similarly, the statistical analysis conducted on geographies consisting of 510,388,718 people shows no correlation between the proportion of Koreans and poverty level in the United States with a correlation coefficient (R) of -0.021 and weighted average of 10.9%, a difference of 38.6%.
Poverty Correlation Summary
| Measurement | Immigrants from Belize | Korean |
| Minimum | 5.2% | 0.27% |
| Maximum | 30.8% | 27.2% |
| Range | 25.7% | 27.0% |
| Mean | 15.4% | 9.8% |
| Median | 14.8% | 9.3% |
| Interquartile 25% (IQ1) | 12.5% | 7.5% |
| Interquartile 75% (IQ3) | 17.4% | 11.6% |
| Interquartile Range (IQR) | 5.0% | 4.0% |
| Standard Deviation (Sample) | 5.6% | 3.9% |
| Standard Deviation (Population) | 5.6% | 3.8% |
Similar Demographics by Poverty
Demographics Similar to Immigrants from Belize by Poverty
In terms of poverty, the demographic groups most similar to Immigrants from Belize are Mexican (15.1%, a difference of 0.10%), Yaqui (15.1%, a difference of 0.12%), Inupiat (15.1%, a difference of 0.13%), Immigrants from Cabo Verde (15.1%, a difference of 0.23%), and Indonesian (15.1%, a difference of 0.28%).
| Demographics | Rating | Rank | Poverty |
| Comanche | 0.0 /100 | #282 | Tragic 15.0% |
| Immigrants | Haiti | 0.0 /100 | #283 | Tragic 15.0% |
| West Indians | 0.0 /100 | #284 | Tragic 15.0% |
| Vietnamese | 0.0 /100 | #285 | Tragic 15.0% |
| Immigrants | Latin America | 0.0 /100 | #286 | Tragic 15.0% |
| Inupiat | 0.0 /100 | #287 | Tragic 15.1% |
| Yaqui | 0.0 /100 | #288 | Tragic 15.1% |
| Immigrants | Belize | 0.0 /100 | #289 | Tragic 15.1% |
| Mexicans | 0.0 /100 | #290 | Tragic 15.1% |
| Immigrants | Cabo Verde | 0.0 /100 | #291 | Tragic 15.1% |
| Indonesians | 0.0 /100 | #292 | Tragic 15.1% |
| Immigrants | Zaire | 0.0 /100 | #293 | Tragic 15.1% |
| Blackfeet | 0.0 /100 | #294 | Tragic 15.2% |
| Guatemalans | 0.0 /100 | #295 | Tragic 15.3% |
| Hispanics or Latinos | 0.0 /100 | #296 | Tragic 15.3% |
Demographics Similar to Koreans by Poverty
In terms of poverty, the demographic groups most similar to Koreans are Immigrants from Singapore (10.9%, a difference of 0.050%), Immigrants from Moldova (10.9%, a difference of 0.19%), Immigrants from Iran (10.9%, a difference of 0.22%), Russian (10.9%, a difference of 0.31%), and Immigrants from Pakistan (10.8%, a difference of 0.36%).
| Demographics | Rating | Rank | Poverty |
| Tongans | 99.4 /100 | #35 | Exceptional 10.8% |
| Cypriots | 99.3 /100 | #36 | Exceptional 10.8% |
| Immigrants | Greece | 99.3 /100 | #37 | Exceptional 10.8% |
| Czechs | 99.3 /100 | #38 | Exceptional 10.8% |
| Immigrants | Pakistan | 99.3 /100 | #39 | Exceptional 10.8% |
| Russians | 99.3 /100 | #40 | Exceptional 10.9% |
| Immigrants | Iran | 99.2 /100 | #41 | Exceptional 10.9% |
| Koreans | 99.2 /100 | #42 | Exceptional 10.9% |
| Immigrants | Singapore | 99.2 /100 | #43 | Exceptional 10.9% |
| Immigrants | Moldova | 99.1 /100 | #44 | Exceptional 10.9% |
| Turks | 98.9 /100 | #45 | Exceptional 11.0% |
| Immigrants | Czechoslovakia | 98.9 /100 | #46 | Exceptional 11.0% |
| Immigrants | Romania | 98.9 /100 | #47 | Exceptional 11.0% |
| Slovenes | 98.9 /100 | #48 | Exceptional 11.0% |
| Immigrants | Japan | 98.9 /100 | #49 | Exceptional 11.0% |