Ghanaian vs Welsh Married-Couple Family Poverty
COMPARE
Ghanaian
Welsh
Married-Couple Family Poverty
Married-Couple Family Poverty Comparison
Ghanaians
Welsh
5.7%
MARRIED-COUPLE FAMILY POVERTY
3.3/ 100
METRIC RATING
236th/ 347
METRIC RANK
4.3%
MARRIED-COUPLE FAMILY POVERTY
99.7/ 100
METRIC RATING
53rd/ 347
METRIC RANK
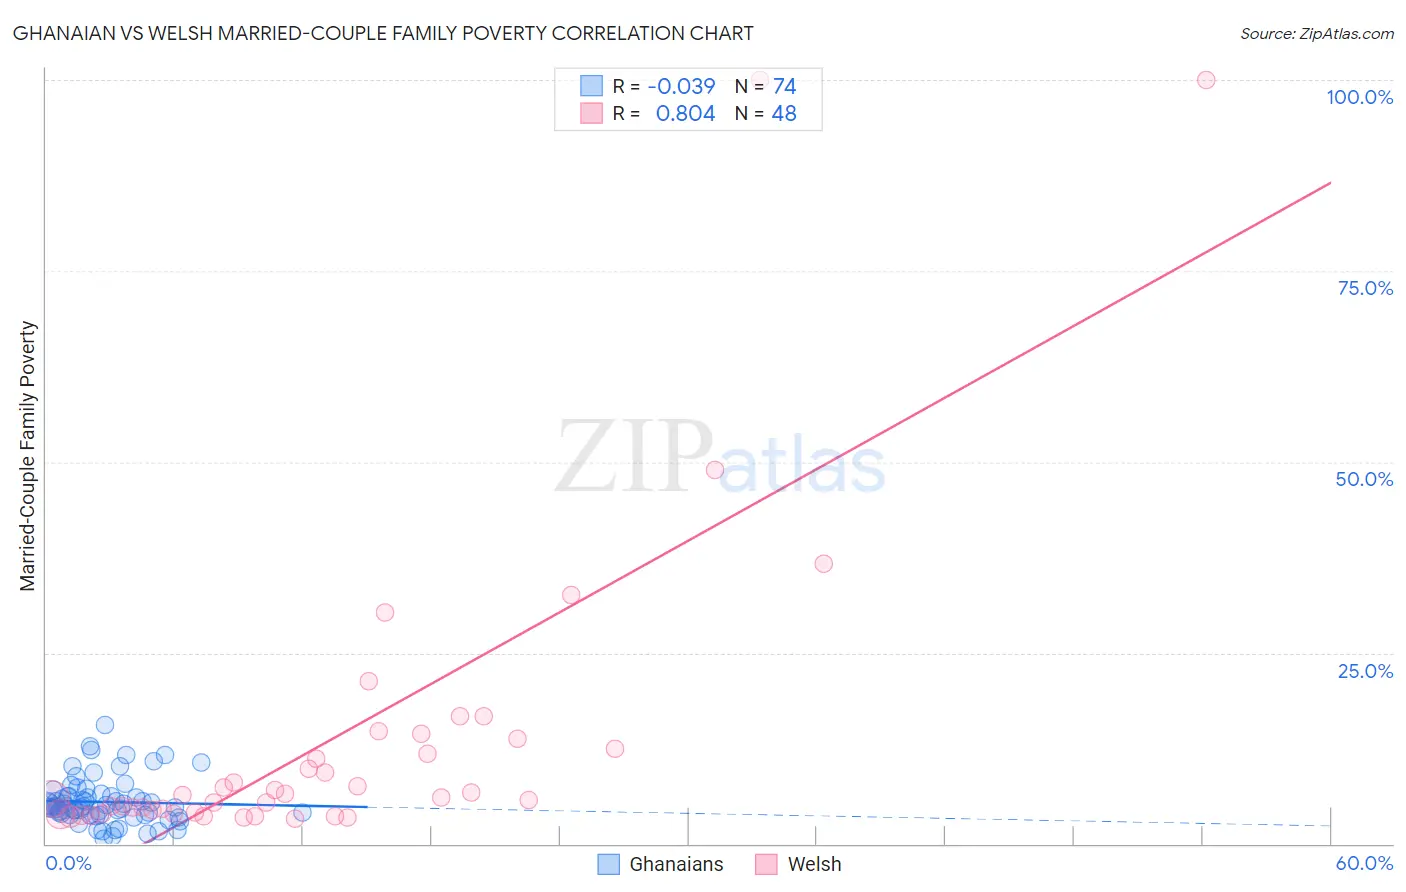
Ghanaian vs Welsh Married-Couple Family Poverty Correlation Chart
The statistical analysis conducted on geographies consisting of 189,762,764 people shows no correlation between the proportion of Ghanaians and poverty level among married-couple families in the United States with a correlation coefficient (R) of -0.039 and weighted average of 5.7%. Similarly, the statistical analysis conducted on geographies consisting of 518,114,778 people shows a very strong positive correlation between the proportion of Welsh and poverty level among married-couple families in the United States with a correlation coefficient (R) of 0.804 and weighted average of 4.3%, a difference of 32.5%.
Married-Couple Family Poverty Correlation Summary
| Measurement | Ghanaian | Welsh |
| Minimum | 0.61% | 3.3% |
| Maximum | 15.5% | 100.0% |
| Range | 14.9% | 96.7% |
| Mean | 5.5% | 13.6% |
| Median | 4.8% | 6.3% |
| Interquartile 25% (IQ1) | 3.8% | 4.1% |
| Interquartile 75% (IQ3) | 6.2% | 13.2% |
| Interquartile Range (IQR) | 2.4% | 9.1% |
| Standard Deviation (Sample) | 3.0% | 20.5% |
| Standard Deviation (Population) | 2.9% | 20.3% |
Similar Demographics by Married-Couple Family Poverty
Demographics Similar to Ghanaians by Married-Couple Family Poverty
In terms of married-couple family poverty, the demographic groups most similar to Ghanaians are Immigrants from Sudan (5.7%, a difference of 0.16%), Immigrants from South America (5.7%, a difference of 0.16%), Immigrants from Colombia (5.7%, a difference of 0.35%), Immigrants from Uruguay (5.7%, a difference of 0.35%), and Cherokee (5.8%, a difference of 0.53%).
| Demographics | Rating | Rank | Married-Couple Family Poverty |
| Sub-Saharan Africans | 4.9 /100 | #229 | Tragic 5.7% |
| Moroccans | 4.9 /100 | #230 | Tragic 5.7% |
| Immigrants | Iraq | 4.4 /100 | #231 | Tragic 5.7% |
| Immigrants | Laos | 4.4 /100 | #232 | Tragic 5.7% |
| Immigrants | Colombia | 3.7 /100 | #233 | Tragic 5.7% |
| Immigrants | Uruguay | 3.7 /100 | #234 | Tragic 5.7% |
| Immigrants | Sudan | 3.5 /100 | #235 | Tragic 5.7% |
| Ghanaians | 3.3 /100 | #236 | Tragic 5.7% |
| Immigrants | South America | 3.1 /100 | #237 | Tragic 5.7% |
| Cherokee | 2.7 /100 | #238 | Tragic 5.8% |
| Venezuelans | 2.7 /100 | #239 | Tragic 5.8% |
| Fijians | 2.5 /100 | #240 | Tragic 5.8% |
| Immigrants | Panama | 2.5 /100 | #241 | Tragic 5.8% |
| Immigrants | Western Africa | 2.4 /100 | #242 | Tragic 5.8% |
| Somalis | 2.3 /100 | #243 | Tragic 5.8% |
Demographics Similar to Welsh by Married-Couple Family Poverty
In terms of married-couple family poverty, the demographic groups most similar to Welsh are Russian (4.3%, a difference of 0.15%), Immigrants from Lithuania (4.3%, a difference of 0.18%), Burmese (4.3%, a difference of 0.19%), Austrian (4.3%, a difference of 0.26%), and Turkish (4.3%, a difference of 0.29%).
| Demographics | Rating | Rank | Married-Couple Family Poverty |
| British | 99.8 /100 | #46 | Exceptional 4.3% |
| Immigrants | South Central Asia | 99.8 /100 | #47 | Exceptional 4.3% |
| Australians | 99.7 /100 | #48 | Exceptional 4.3% |
| Turks | 99.7 /100 | #49 | Exceptional 4.3% |
| Burmese | 99.7 /100 | #50 | Exceptional 4.3% |
| Immigrants | Lithuania | 99.7 /100 | #51 | Exceptional 4.3% |
| Russians | 99.7 /100 | #52 | Exceptional 4.3% |
| Welsh | 99.7 /100 | #53 | Exceptional 4.3% |
| Austrians | 99.7 /100 | #54 | Exceptional 4.3% |
| French | 99.7 /100 | #55 | Exceptional 4.3% |
| Immigrants | Zimbabwe | 99.7 /100 | #56 | Exceptional 4.3% |
| Immigrants | Netherlands | 99.7 /100 | #57 | Exceptional 4.3% |
| Czechoslovakians | 99.7 /100 | #58 | Exceptional 4.4% |
| Immigrants | Sweden | 99.6 /100 | #59 | Exceptional 4.4% |
| Tlingit-Haida | 99.6 /100 | #60 | Exceptional 4.4% |