Houma vs Trinidadian and Tobagonian 11th Grade
COMPARE
Houma
Trinidadian and Tobagonian
11th Grade
11th Grade Comparison
Houma
Trinidadians and Tobagonians
87.0%
11TH GRADE
0.0/ 100
METRIC RATING
334th/ 347
METRIC RANK
91.1%
11TH GRADE
0.2/ 100
METRIC RATING
270th/ 347
METRIC RANK
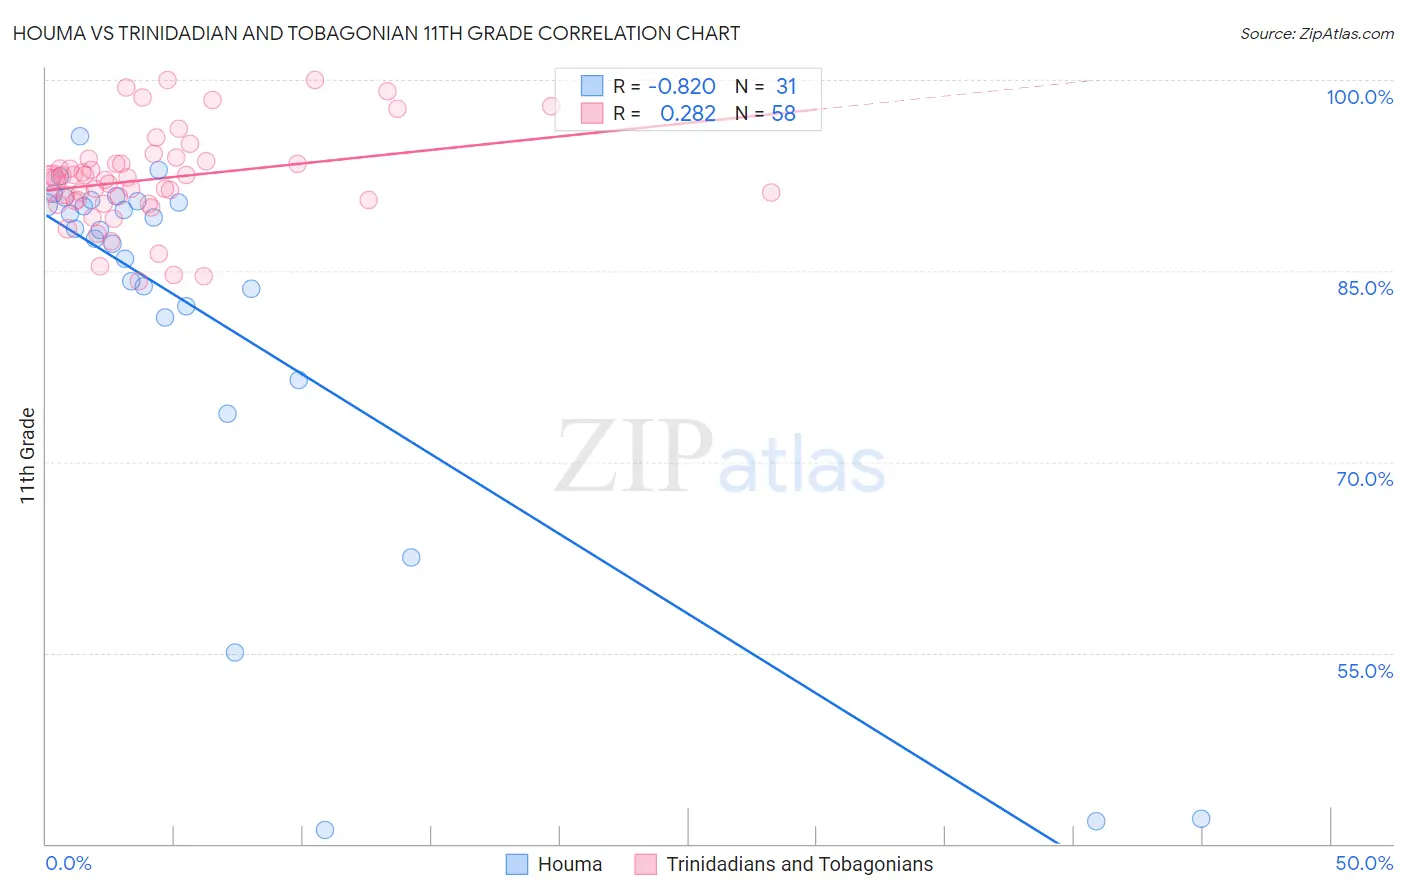
Houma vs Trinidadian and Tobagonian 11th Grade Correlation Chart
The statistical analysis conducted on geographies consisting of 36,795,916 people shows a very strong negative correlation between the proportion of Houma and percentage of population with at least 11th grade education in the United States with a correlation coefficient (R) of -0.820 and weighted average of 87.0%. Similarly, the statistical analysis conducted on geographies consisting of 219,881,170 people shows a weak positive correlation between the proportion of Trinidadians and Tobagonians and percentage of population with at least 11th grade education in the United States with a correlation coefficient (R) of 0.282 and weighted average of 91.1%, a difference of 4.6%.
11th Grade Correlation Summary
| Measurement | Houma | Trinidadian and Tobagonian |
| Minimum | 41.1% | 84.2% |
| Maximum | 95.5% | 100.0% |
| Range | 54.5% | 15.8% |
| Mean | 81.2% | 92.2% |
| Median | 88.2% | 92.2% |
| Interquartile 25% (IQ1) | 81.4% | 90.5% |
| Interquartile 75% (IQ3) | 90.4% | 93.7% |
| Interquartile Range (IQR) | 9.1% | 3.2% |
| Standard Deviation (Sample) | 15.7% | 3.7% |
| Standard Deviation (Population) | 15.5% | 3.7% |
Similar Demographics by 11th Grade
Demographics Similar to Houma by 11th Grade
In terms of 11th grade, the demographic groups most similar to Houma are Immigrants from Yemen (87.1%, a difference of 0.060%), Central American (86.9%, a difference of 0.10%), Immigrants from Dominican Republic (86.9%, a difference of 0.14%), Immigrants from Honduras (86.9%, a difference of 0.14%), and Immigrants from the Azores (87.2%, a difference of 0.24%).
| Demographics | Rating | Rank | 11th Grade |
| Immigrants | Cabo Verde | 0.0 /100 | #327 | Tragic 87.6% |
| Tohono O'odham | 0.0 /100 | #328 | Tragic 87.6% |
| Mexican American Indians | 0.0 /100 | #329 | Tragic 87.5% |
| Hondurans | 0.0 /100 | #330 | Tragic 87.4% |
| Hispanics or Latinos | 0.0 /100 | #331 | Tragic 87.3% |
| Immigrants | Azores | 0.0 /100 | #332 | Tragic 87.2% |
| Immigrants | Yemen | 0.0 /100 | #333 | Tragic 87.1% |
| Houma | 0.0 /100 | #334 | Tragic 87.0% |
| Central Americans | 0.0 /100 | #335 | Tragic 86.9% |
| Immigrants | Dominican Republic | 0.0 /100 | #336 | Tragic 86.9% |
| Immigrants | Honduras | 0.0 /100 | #337 | Tragic 86.9% |
| Immigrants | Latin America | 0.0 /100 | #338 | Tragic 86.8% |
| Guatemalans | 0.0 /100 | #339 | Tragic 86.4% |
| Salvadorans | 0.0 /100 | #340 | Tragic 86.2% |
| Mexicans | 0.0 /100 | #341 | Tragic 86.1% |
Demographics Similar to Trinidadians and Tobagonians by 11th Grade
In terms of 11th grade, the demographic groups most similar to Trinidadians and Tobagonians are Ute (91.1%, a difference of 0.030%), Immigrants from Peru (91.0%, a difference of 0.030%), West Indian (91.0%, a difference of 0.040%), U.S. Virgin Islander (91.1%, a difference of 0.060%), and Paiute (91.0%, a difference of 0.080%).
| Demographics | Rating | Rank | 11th Grade |
| Immigrants | Ghana | 0.3 /100 | #263 | Tragic 91.2% |
| Yup'ik | 0.3 /100 | #264 | Tragic 91.2% |
| Pueblo | 0.3 /100 | #265 | Tragic 91.2% |
| Immigrants | Western Africa | 0.3 /100 | #266 | Tragic 91.2% |
| Immigrants | Jamaica | 0.3 /100 | #267 | Tragic 91.2% |
| U.S. Virgin Islanders | 0.2 /100 | #268 | Tragic 91.1% |
| Ute | 0.2 /100 | #269 | Tragic 91.1% |
| Trinidadians and Tobagonians | 0.2 /100 | #270 | Tragic 91.1% |
| Immigrants | Peru | 0.1 /100 | #271 | Tragic 91.0% |
| West Indians | 0.1 /100 | #272 | Tragic 91.0% |
| Paiute | 0.1 /100 | #273 | Tragic 91.0% |
| Immigrants | Trinidad and Tobago | 0.1 /100 | #274 | Tragic 90.9% |
| Immigrants | South Eastern Asia | 0.1 /100 | #275 | Tragic 90.9% |
| Bangladeshis | 0.1 /100 | #276 | Tragic 90.9% |
| Immigrants | Congo | 0.1 /100 | #277 | Tragic 90.9% |