Houma vs Trinidadian and Tobagonian 1 or more Vehicles in Household
COMPARE
Houma
Trinidadian and Tobagonian
1 or more Vehicles in Household
1 or more Vehicles in Household Comparison
Houma
Trinidadians and Tobagonians
88.6%
1 OR MORE VEHICLES IN HOUSEHOLD
4.8/ 100
METRIC RATING
233rd/ 347
METRIC RANK
76.3%
1 OR MORE VEHICLES IN HOUSEHOLD
0.0/ 100
METRIC RATING
332nd/ 347
METRIC RANK
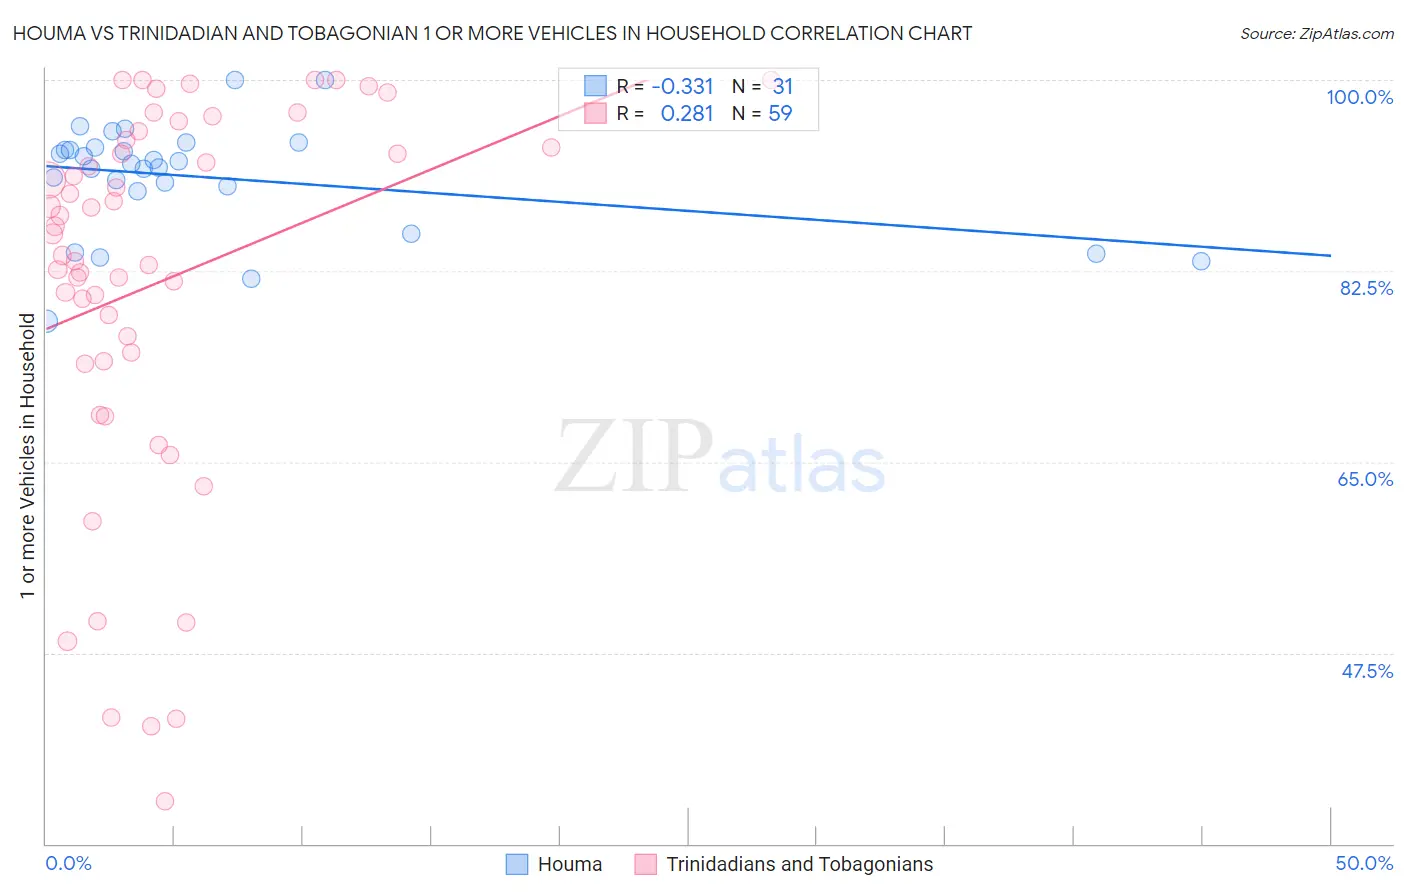
Houma vs Trinidadian and Tobagonian 1 or more Vehicles in Household Correlation Chart
The statistical analysis conducted on geographies consisting of 36,796,778 people shows a mild negative correlation between the proportion of Houma and percentage of households with 1 or more vehicles available in the United States with a correlation coefficient (R) of -0.331 and weighted average of 88.6%. Similarly, the statistical analysis conducted on geographies consisting of 219,744,426 people shows a weak positive correlation between the proportion of Trinidadians and Tobagonians and percentage of households with 1 or more vehicles available in the United States with a correlation coefficient (R) of 0.281 and weighted average of 76.3%, a difference of 16.2%.
1 or more Vehicles in Household Correlation Summary
| Measurement | Houma | Trinidadian and Tobagonian |
| Minimum | 77.9% | 33.9% |
| Maximum | 100.0% | 100.0% |
| Range | 22.1% | 66.1% |
| Mean | 91.0% | 81.5% |
| Median | 92.3% | 85.9% |
| Interquartile 25% (IQ1) | 89.7% | 74.2% |
| Interquartile 75% (IQ3) | 93.8% | 94.5% |
| Interquartile Range (IQR) | 4.0% | 20.3% |
| Standard Deviation (Sample) | 5.1% | 17.3% |
| Standard Deviation (Population) | 5.0% | 17.2% |
Similar Demographics by 1 or more Vehicles in Household
Demographics Similar to Houma by 1 or more Vehicles in Household
In terms of 1 or more vehicles in household, the demographic groups most similar to Houma are Immigrants from Japan (88.7%, a difference of 0.010%), Immigrants from Peru (88.6%, a difference of 0.010%), Paiute (88.6%, a difference of 0.010%), Russian (88.7%, a difference of 0.020%), and Immigrants from Pakistan (88.6%, a difference of 0.030%).
| Demographics | Rating | Rank | 1 or more Vehicles in Household |
| Cheyenne | 5.7 /100 | #226 | Tragic 88.7% |
| Ute | 5.6 /100 | #227 | Tragic 88.7% |
| Immigrants | Norway | 5.5 /100 | #228 | Tragic 88.7% |
| Immigrants | Romania | 5.4 /100 | #229 | Tragic 88.7% |
| Immigrants | Sierra Leone | 5.2 /100 | #230 | Tragic 88.7% |
| Russians | 5.0 /100 | #231 | Tragic 88.7% |
| Immigrants | Japan | 4.9 /100 | #232 | Tragic 88.7% |
| Houma | 4.8 /100 | #233 | Tragic 88.6% |
| Immigrants | Peru | 4.7 /100 | #234 | Tragic 88.6% |
| Paiute | 4.6 /100 | #235 | Tragic 88.6% |
| Immigrants | Pakistan | 4.5 /100 | #236 | Tragic 88.6% |
| Immigrants | Turkey | 4.4 /100 | #237 | Tragic 88.6% |
| Immigrants | Somalia | 4.2 /100 | #238 | Tragic 88.6% |
| Kiowa | 3.8 /100 | #239 | Tragic 88.6% |
| Eastern Europeans | 3.0 /100 | #240 | Tragic 88.5% |
Demographics Similar to Trinidadians and Tobagonians by 1 or more Vehicles in Household
In terms of 1 or more vehicles in household, the demographic groups most similar to Trinidadians and Tobagonians are West Indian (76.4%, a difference of 0.080%), Immigrants from Ecuador (76.2%, a difference of 0.10%), Immigrants from Trinidad and Tobago (76.8%, a difference of 0.64%), Immigrants from Dominica (77.8%, a difference of 2.0%), and Ecuadorian (77.9%, a difference of 2.1%).
| Demographics | Rating | Rank | 1 or more Vehicles in Household |
| Senegalese | 0.0 /100 | #325 | Tragic 80.4% |
| Immigrants | West Indies | 0.0 /100 | #326 | Tragic 79.5% |
| Immigrants | Senegal | 0.0 /100 | #327 | Tragic 79.0% |
| Ecuadorians | 0.0 /100 | #328 | Tragic 77.9% |
| Immigrants | Dominica | 0.0 /100 | #329 | Tragic 77.8% |
| Immigrants | Trinidad and Tobago | 0.0 /100 | #330 | Tragic 76.8% |
| West Indians | 0.0 /100 | #331 | Tragic 76.4% |
| Trinidadians and Tobagonians | 0.0 /100 | #332 | Tragic 76.3% |
| Immigrants | Ecuador | 0.0 /100 | #333 | Tragic 76.2% |
| Immigrants | Bangladesh | 0.0 /100 | #334 | Tragic 74.3% |
| Barbadians | 0.0 /100 | #335 | Tragic 74.0% |
| Vietnamese | 0.0 /100 | #336 | Tragic 73.8% |
| Immigrants | Uzbekistan | 0.0 /100 | #337 | Tragic 73.4% |
| Inupiat | 0.0 /100 | #338 | Tragic 71.5% |
| Guyanese | 0.0 /100 | #339 | Tragic 70.8% |