Houma vs Scandinavian Family Poverty
COMPARE
Houma
Scandinavian
Family Poverty
Family Poverty Comparison
Houma
Scandinavians
14.6%
FAMILY POVERTY
0.0/ 100
METRIC RATING
334th/ 347
METRIC RANK
7.6%
FAMILY POVERTY
99.1/ 100
METRIC RATING
42nd/ 347
METRIC RANK
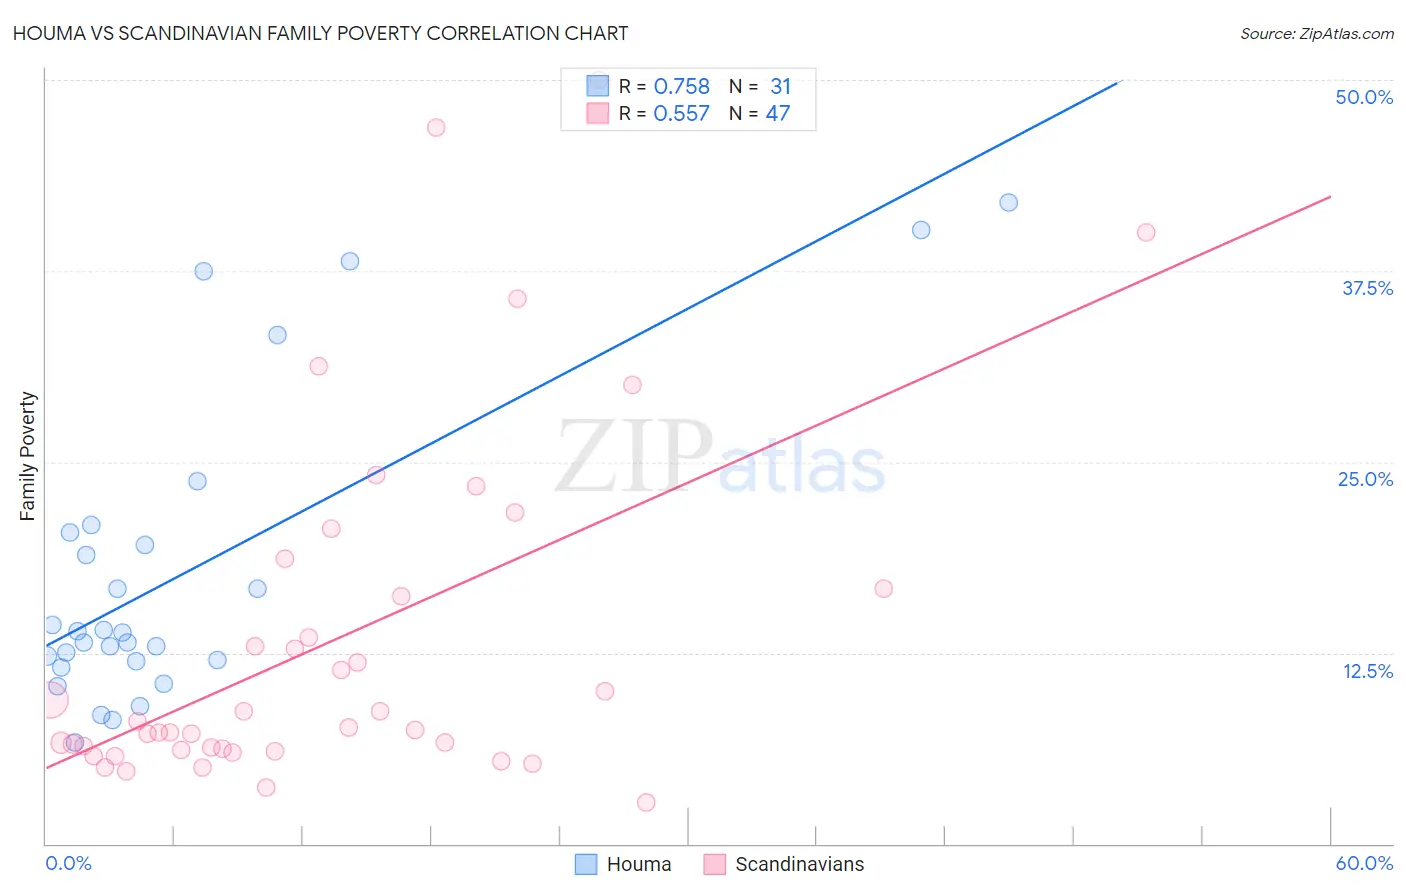
Houma vs Scandinavian Family Poverty Correlation Chart
The statistical analysis conducted on geographies consisting of 36,784,035 people shows a strong positive correlation between the proportion of Houma and poverty level among families in the United States with a correlation coefficient (R) of 0.758 and weighted average of 14.6%. Similarly, the statistical analysis conducted on geographies consisting of 470,471,633 people shows a substantial positive correlation between the proportion of Scandinavians and poverty level among families in the United States with a correlation coefficient (R) of 0.557 and weighted average of 7.6%, a difference of 91.9%.
Family Poverty Correlation Summary
| Measurement | Houma | Scandinavian |
| Minimum | 6.6% | 2.7% |
| Maximum | 42.0% | 50.0% |
| Range | 35.4% | 47.3% |
| Mean | 17.7% | 13.3% |
| Median | 13.8% | 7.6% |
| Interquartile 25% (IQ1) | 12.0% | 6.2% |
| Interquartile 75% (IQ3) | 20.4% | 16.7% |
| Interquartile Range (IQR) | 8.4% | 10.5% |
| Standard Deviation (Sample) | 10.0% | 11.5% |
| Standard Deviation (Population) | 9.8% | 11.4% |
Similar Demographics by Family Poverty
Demographics Similar to Houma by Family Poverty
In terms of family poverty, the demographic groups most similar to Houma are Apache (14.7%, a difference of 0.85%), Immigrants from Dominican Republic (14.4%, a difference of 1.3%), Dominican (14.3%, a difference of 1.9%), Cheyenne (14.3%, a difference of 2.4%), and Native/Alaskan (14.3%, a difference of 2.5%).
| Demographics | Rating | Rank | Family Poverty |
| Yakama | 0.0 /100 | #327 | Tragic 13.1% |
| Central American Indians | 0.0 /100 | #328 | Tragic 13.3% |
| Blacks/African Americans | 0.0 /100 | #329 | Tragic 13.3% |
| Natives/Alaskans | 0.0 /100 | #330 | Tragic 14.3% |
| Cheyenne | 0.0 /100 | #331 | Tragic 14.3% |
| Dominicans | 0.0 /100 | #332 | Tragic 14.3% |
| Immigrants | Dominican Republic | 0.0 /100 | #333 | Tragic 14.4% |
| Houma | 0.0 /100 | #334 | Tragic 14.6% |
| Apache | 0.0 /100 | #335 | Tragic 14.7% |
| Sioux | 0.0 /100 | #336 | Tragic 15.9% |
| Hopi | 0.0 /100 | #337 | Tragic 15.9% |
| Crow | 0.0 /100 | #338 | Tragic 16.1% |
| Yuman | 0.0 /100 | #339 | Tragic 16.6% |
| Pueblo | 0.0 /100 | #340 | Tragic 17.0% |
| Lumbee | 0.0 /100 | #341 | Tragic 17.0% |
Demographics Similar to Scandinavians by Family Poverty
In terms of family poverty, the demographic groups most similar to Scandinavians are Immigrants from Austria (7.6%, a difference of 0.24%), German (7.7%, a difference of 0.53%), Immigrants from Australia (7.6%, a difference of 0.63%), Okinawan (7.7%, a difference of 0.65%), and Tongan (7.7%, a difference of 0.67%).
| Demographics | Rating | Rank | Family Poverty |
| Greeks | 99.4 /100 | #35 | Exceptional 7.5% |
| Turks | 99.4 /100 | #36 | Exceptional 7.5% |
| Estonians | 99.4 /100 | #37 | Exceptional 7.5% |
| Bolivians | 99.3 /100 | #38 | Exceptional 7.5% |
| Carpatho Rusyns | 99.3 /100 | #39 | Exceptional 7.5% |
| Slovenes | 99.3 /100 | #40 | Exceptional 7.5% |
| Immigrants | Australia | 99.2 /100 | #41 | Exceptional 7.6% |
| Scandinavians | 99.1 /100 | #42 | Exceptional 7.6% |
| Immigrants | Austria | 99.1 /100 | #43 | Exceptional 7.6% |
| Germans | 99.0 /100 | #44 | Exceptional 7.7% |
| Okinawans | 98.9 /100 | #45 | Exceptional 7.7% |
| Tongans | 98.9 /100 | #46 | Exceptional 7.7% |
| Immigrants | Czechoslovakia | 98.9 /100 | #47 | Exceptional 7.7% |
| Immigrants | Sri Lanka | 98.9 /100 | #48 | Exceptional 7.7% |
| Immigrants | Bolivia | 98.9 /100 | #49 | Exceptional 7.7% |