Houma vs Immigrants from Uruguay Family Poverty
COMPARE
Houma
Immigrants from Uruguay
Family Poverty
Family Poverty Comparison
Houma
Immigrants from Uruguay
14.6%
FAMILY POVERTY
0.0/ 100
METRIC RATING
334th/ 347
METRIC RANK
9.5%
FAMILY POVERTY
14.0/ 100
METRIC RATING
209th/ 347
METRIC RANK
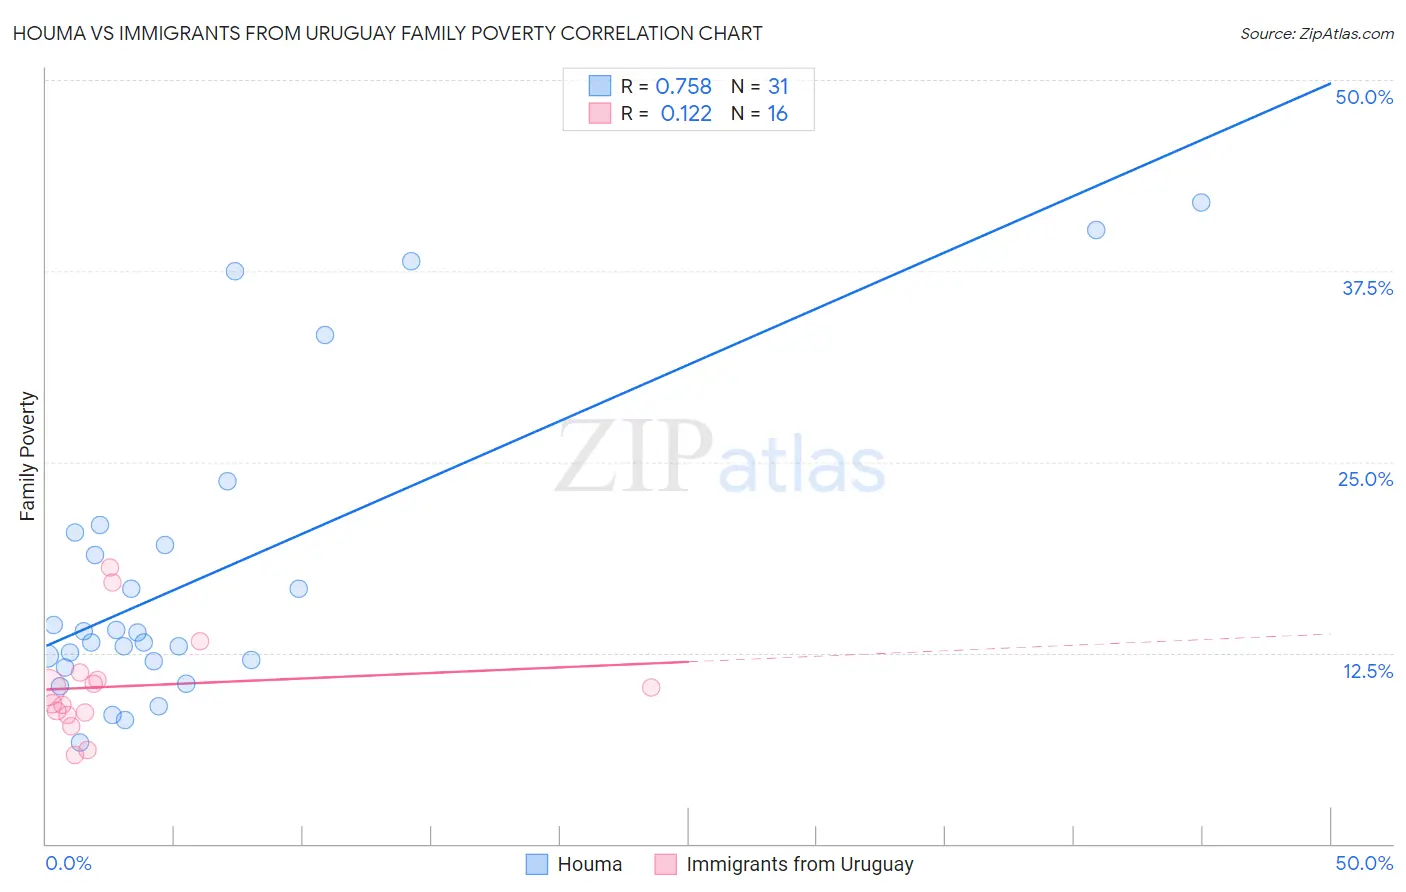
Houma vs Immigrants from Uruguay Family Poverty Correlation Chart
The statistical analysis conducted on geographies consisting of 36,784,035 people shows a strong positive correlation between the proportion of Houma and poverty level among families in the United States with a correlation coefficient (R) of 0.758 and weighted average of 14.6%. Similarly, the statistical analysis conducted on geographies consisting of 133,161,280 people shows a poor positive correlation between the proportion of Immigrants from Uruguay and poverty level among families in the United States with a correlation coefficient (R) of 0.122 and weighted average of 9.5%, a difference of 53.2%.
Family Poverty Correlation Summary
| Measurement | Houma | Immigrants from Uruguay |
| Minimum | 6.6% | 5.8% |
| Maximum | 42.0% | 18.1% |
| Range | 35.4% | 12.2% |
| Mean | 17.7% | 10.3% |
| Median | 13.8% | 9.7% |
| Interquartile 25% (IQ1) | 12.0% | 8.5% |
| Interquartile 75% (IQ3) | 20.4% | 11.0% |
| Interquartile Range (IQR) | 8.4% | 2.5% |
| Standard Deviation (Sample) | 10.0% | 3.4% |
| Standard Deviation (Population) | 9.8% | 3.3% |
Similar Demographics by Family Poverty
Demographics Similar to Houma by Family Poverty
In terms of family poverty, the demographic groups most similar to Houma are Apache (14.7%, a difference of 0.85%), Immigrants from Dominican Republic (14.4%, a difference of 1.3%), Dominican (14.3%, a difference of 1.9%), Cheyenne (14.3%, a difference of 2.4%), and Native/Alaskan (14.3%, a difference of 2.5%).
| Demographics | Rating | Rank | Family Poverty |
| Yakama | 0.0 /100 | #327 | Tragic 13.1% |
| Central American Indians | 0.0 /100 | #328 | Tragic 13.3% |
| Blacks/African Americans | 0.0 /100 | #329 | Tragic 13.3% |
| Natives/Alaskans | 0.0 /100 | #330 | Tragic 14.3% |
| Cheyenne | 0.0 /100 | #331 | Tragic 14.3% |
| Dominicans | 0.0 /100 | #332 | Tragic 14.3% |
| Immigrants | Dominican Republic | 0.0 /100 | #333 | Tragic 14.4% |
| Houma | 0.0 /100 | #334 | Tragic 14.6% |
| Apache | 0.0 /100 | #335 | Tragic 14.7% |
| Sioux | 0.0 /100 | #336 | Tragic 15.9% |
| Hopi | 0.0 /100 | #337 | Tragic 15.9% |
| Crow | 0.0 /100 | #338 | Tragic 16.1% |
| Yuman | 0.0 /100 | #339 | Tragic 16.6% |
| Pueblo | 0.0 /100 | #340 | Tragic 17.0% |
| Lumbee | 0.0 /100 | #341 | Tragic 17.0% |
Demographics Similar to Immigrants from Uruguay by Family Poverty
In terms of family poverty, the demographic groups most similar to Immigrants from Uruguay are Immigrants from Eastern Africa (9.5%, a difference of 0.29%), Sierra Leonean (9.5%, a difference of 0.40%), Alsatian (9.6%, a difference of 0.73%), Immigrants from South America (9.5%, a difference of 0.93%), and Aleut (9.5%, a difference of 0.94%).
| Demographics | Rating | Rank | Family Poverty |
| Immigrants | Sierra Leone | 19.6 /100 | #202 | Poor 9.4% |
| German Russians | 19.4 /100 | #203 | Poor 9.4% |
| Immigrants | Lebanon | 18.9 /100 | #204 | Poor 9.4% |
| Aleuts | 18.0 /100 | #205 | Poor 9.5% |
| Immigrants | South America | 18.0 /100 | #206 | Poor 9.5% |
| Sierra Leoneans | 15.6 /100 | #207 | Poor 9.5% |
| Immigrants | Eastern Africa | 15.1 /100 | #208 | Poor 9.5% |
| Immigrants | Uruguay | 14.0 /100 | #209 | Poor 9.5% |
| Alsatians | 11.3 /100 | #210 | Poor 9.6% |
| Malaysians | 10.6 /100 | #211 | Poor 9.6% |
| Immigrants | Thailand | 9.7 /100 | #212 | Tragic 9.7% |
| Osage | 8.0 /100 | #213 | Tragic 9.7% |
| Immigrants | Micronesia | 6.7 /100 | #214 | Tragic 9.8% |
| Immigrants | Nonimmigrants | 6.7 /100 | #215 | Tragic 9.8% |
| Moroccans | 6.5 /100 | #216 | Tragic 9.8% |