Houma vs Thai Family Poverty
COMPARE
Houma
Thai
Family Poverty
Family Poverty Comparison
Houma
Thais
14.6%
FAMILY POVERTY
0.0/ 100
METRIC RATING
334th/ 347
METRIC RANK
6.7%
FAMILY POVERTY
100.0/ 100
METRIC RATING
5th/ 347
METRIC RANK
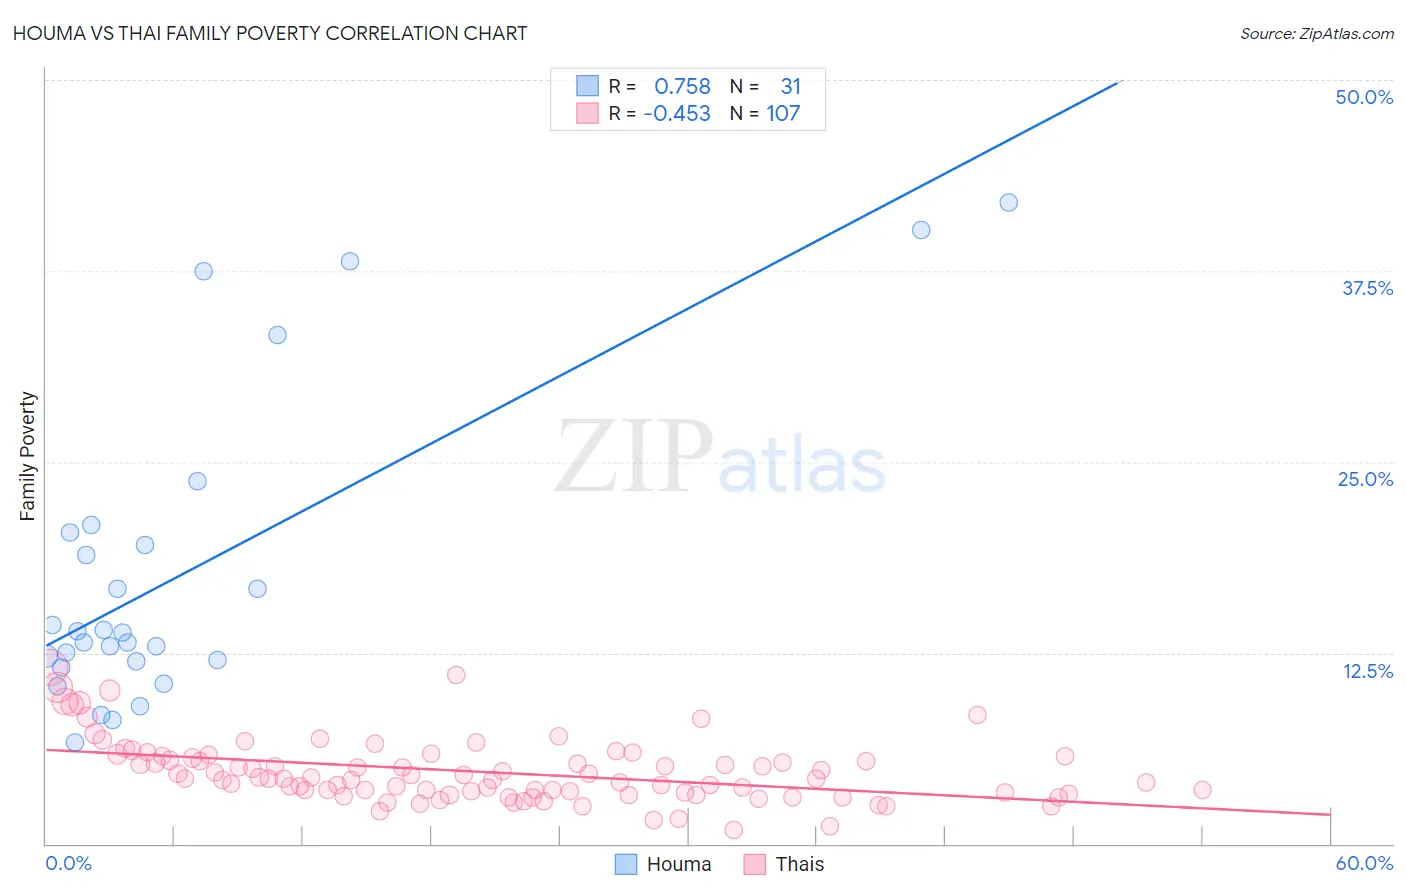
Houma vs Thai Family Poverty Correlation Chart
The statistical analysis conducted on geographies consisting of 36,784,035 people shows a strong positive correlation between the proportion of Houma and poverty level among families in the United States with a correlation coefficient (R) of 0.758 and weighted average of 14.6%. Similarly, the statistical analysis conducted on geographies consisting of 473,767,426 people shows a moderate negative correlation between the proportion of Thais and poverty level among families in the United States with a correlation coefficient (R) of -0.453 and weighted average of 6.7%, a difference of 118.6%.
Family Poverty Correlation Summary
| Measurement | Houma | Thai |
| Minimum | 6.6% | 0.91% |
| Maximum | 42.0% | 11.5% |
| Range | 35.4% | 10.6% |
| Mean | 17.7% | 4.7% |
| Median | 13.8% | 4.3% |
| Interquartile 25% (IQ1) | 12.0% | 3.3% |
| Interquartile 75% (IQ3) | 20.4% | 5.7% |
| Interquartile Range (IQR) | 8.4% | 2.4% |
| Standard Deviation (Sample) | 10.0% | 2.1% |
| Standard Deviation (Population) | 9.8% | 2.1% |
Similar Demographics by Family Poverty
Demographics Similar to Houma by Family Poverty
In terms of family poverty, the demographic groups most similar to Houma are Apache (14.7%, a difference of 0.85%), Immigrants from Dominican Republic (14.4%, a difference of 1.3%), Dominican (14.3%, a difference of 1.9%), Cheyenne (14.3%, a difference of 2.4%), and Native/Alaskan (14.3%, a difference of 2.5%).
| Demographics | Rating | Rank | Family Poverty |
| Yakama | 0.0 /100 | #327 | Tragic 13.1% |
| Central American Indians | 0.0 /100 | #328 | Tragic 13.3% |
| Blacks/African Americans | 0.0 /100 | #329 | Tragic 13.3% |
| Natives/Alaskans | 0.0 /100 | #330 | Tragic 14.3% |
| Cheyenne | 0.0 /100 | #331 | Tragic 14.3% |
| Dominicans | 0.0 /100 | #332 | Tragic 14.3% |
| Immigrants | Dominican Republic | 0.0 /100 | #333 | Tragic 14.4% |
| Houma | 0.0 /100 | #334 | Tragic 14.6% |
| Apache | 0.0 /100 | #335 | Tragic 14.7% |
| Sioux | 0.0 /100 | #336 | Tragic 15.9% |
| Hopi | 0.0 /100 | #337 | Tragic 15.9% |
| Crow | 0.0 /100 | #338 | Tragic 16.1% |
| Yuman | 0.0 /100 | #339 | Tragic 16.6% |
| Pueblo | 0.0 /100 | #340 | Tragic 17.0% |
| Lumbee | 0.0 /100 | #341 | Tragic 17.0% |
Demographics Similar to Thais by Family Poverty
In terms of family poverty, the demographic groups most similar to Thais are Filipino (6.6%, a difference of 0.57%), Immigrants from Taiwan (6.6%, a difference of 1.2%), Chinese (6.5%, a difference of 2.8%), Norwegian (6.9%, a difference of 3.0%), and Immigrants from Ireland (7.0%, a difference of 4.4%).
| Demographics | Rating | Rank | Family Poverty |
| Immigrants | India | 100.0 /100 | #1 | Exceptional 6.2% |
| Chinese | 100.0 /100 | #2 | Exceptional 6.5% |
| Immigrants | Taiwan | 100.0 /100 | #3 | Exceptional 6.6% |
| Filipinos | 100.0 /100 | #4 | Exceptional 6.6% |
| Thais | 100.0 /100 | #5 | Exceptional 6.7% |
| Norwegians | 99.9 /100 | #6 | Exceptional 6.9% |
| Immigrants | Ireland | 99.9 /100 | #7 | Exceptional 7.0% |
| Bhutanese | 99.9 /100 | #8 | Exceptional 7.0% |
| Latvians | 99.9 /100 | #9 | Exceptional 7.1% |
| Bulgarians | 99.8 /100 | #10 | Exceptional 7.1% |
| Immigrants | Singapore | 99.8 /100 | #11 | Exceptional 7.1% |
| Maltese | 99.8 /100 | #12 | Exceptional 7.1% |
| Swedes | 99.8 /100 | #13 | Exceptional 7.1% |
| Iranians | 99.8 /100 | #14 | Exceptional 7.1% |
| Lithuanians | 99.8 /100 | #15 | Exceptional 7.2% |