Houma vs Immigrants from Guyana Bachelor's Degree
COMPARE
Houma
Immigrants from Guyana
Bachelor's Degree
Bachelor's Degree Comparison
Houma
Immigrants from Guyana
21.4%
BACHELOR'S DEGREE
0.0/ 100
METRIC RATING
346th/ 347
METRIC RANK
33.9%
BACHELOR'S DEGREE
1.4/ 100
METRIC RATING
243rd/ 347
METRIC RANK
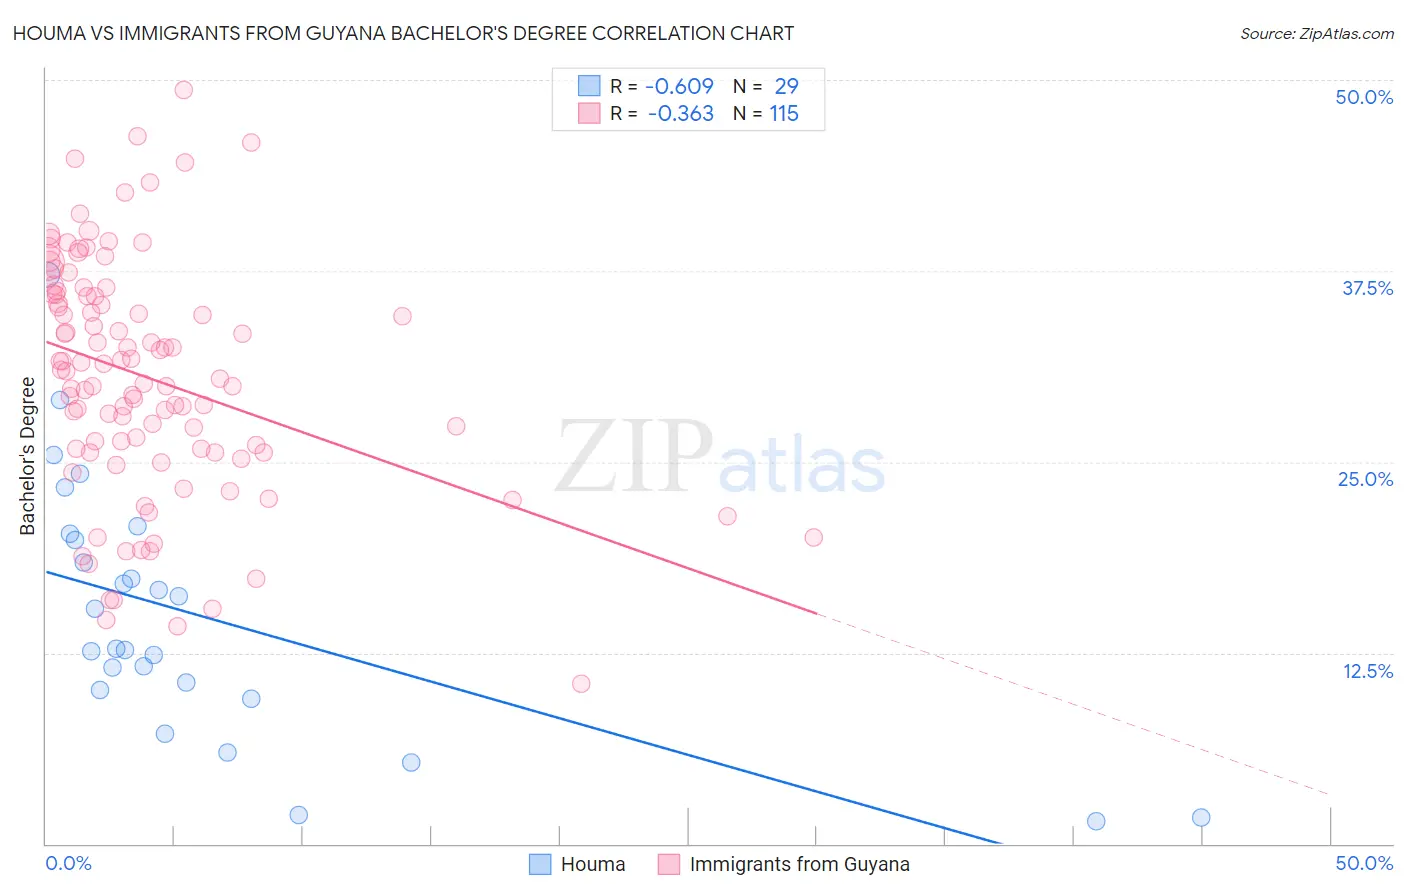
Houma vs Immigrants from Guyana Bachelor's Degree Correlation Chart
The statistical analysis conducted on geographies consisting of 36,792,534 people shows a significant negative correlation between the proportion of Houma and percentage of population with at least bachelor's degree education in the United States with a correlation coefficient (R) of -0.609 and weighted average of 21.4%. Similarly, the statistical analysis conducted on geographies consisting of 183,738,689 people shows a mild negative correlation between the proportion of Immigrants from Guyana and percentage of population with at least bachelor's degree education in the United States with a correlation coefficient (R) of -0.363 and weighted average of 33.9%, a difference of 58.4%.
Bachelor's Degree Correlation Summary
| Measurement | Houma | Immigrants from Guyana |
| Minimum | 1.5% | 10.5% |
| Maximum | 37.2% | 49.4% |
| Range | 35.8% | 38.9% |
| Mean | 14.8% | 30.5% |
| Median | 12.8% | 31.0% |
| Interquartile 25% (IQ1) | 9.8% | 25.6% |
| Interquartile 75% (IQ3) | 20.1% | 36.0% |
| Interquartile Range (IQR) | 10.3% | 10.3% |
| Standard Deviation (Sample) | 8.4% | 7.7% |
| Standard Deviation (Population) | 8.2% | 7.7% |
Similar Demographics by Bachelor's Degree
Demographics Similar to Houma by Bachelor's Degree
In terms of bachelor's degree, the demographic groups most similar to Houma are Pima (23.2%, a difference of 8.3%), Navajo (23.6%, a difference of 10.2%), Yup'ik (19.4%, a difference of 10.4%), Tohono O'odham (24.4%, a difference of 14.0%), and Yakama (24.5%, a difference of 14.2%).
| Demographics | Rating | Rank | Bachelor's Degree |
| Mexicans | 0.0 /100 | #333 | Tragic 27.1% |
| Arapaho | 0.0 /100 | #334 | Tragic 26.6% |
| Natives/Alaskans | 0.0 /100 | #335 | Tragic 26.3% |
| Immigrants | Mexico | 0.0 /100 | #336 | Tragic 26.1% |
| Inupiat | 0.0 /100 | #337 | Tragic 25.8% |
| Pueblo | 0.0 /100 | #338 | Tragic 25.5% |
| Hopi | 0.0 /100 | #339 | Tragic 25.3% |
| Lumbee | 0.0 /100 | #340 | Tragic 24.8% |
| Yuman | 0.0 /100 | #341 | Tragic 24.5% |
| Yakama | 0.0 /100 | #342 | Tragic 24.5% |
| Tohono O'odham | 0.0 /100 | #343 | Tragic 24.4% |
| Navajo | 0.0 /100 | #344 | Tragic 23.6% |
| Pima | 0.0 /100 | #345 | Tragic 23.2% |
| Houma | 0.0 /100 | #346 | Tragic 21.4% |
| Yup'ik | 0.0 /100 | #347 | Tragic 19.4% |
Demographics Similar to Immigrants from Guyana by Bachelor's Degree
In terms of bachelor's degree, the demographic groups most similar to Immigrants from Guyana are Delaware (33.8%, a difference of 0.50%), Immigrants from Fiji (33.7%, a difference of 0.59%), Nonimmigrants (34.2%, a difference of 0.64%), Immigrants from Cambodia (34.2%, a difference of 0.71%), and Jamaican (33.6%, a difference of 0.96%).
| Demographics | Rating | Rank | Bachelor's Degree |
| Liberians | 2.8 /100 | #236 | Tragic 34.6% |
| Tlingit-Haida | 2.8 /100 | #237 | Tragic 34.6% |
| Guyanese | 2.5 /100 | #238 | Tragic 34.5% |
| British West Indians | 2.5 /100 | #239 | Tragic 34.5% |
| Tongans | 2.0 /100 | #240 | Tragic 34.3% |
| Immigrants | Cambodia | 1.9 /100 | #241 | Tragic 34.2% |
| Immigrants | Nonimmigrants | 1.8 /100 | #242 | Tragic 34.2% |
| Immigrants | Guyana | 1.4 /100 | #243 | Tragic 33.9% |
| Delaware | 1.2 /100 | #244 | Tragic 33.8% |
| Immigrants | Fiji | 1.2 /100 | #245 | Tragic 33.7% |
| Jamaicans | 1.0 /100 | #246 | Tragic 33.6% |
| Immigrants | Congo | 1.0 /100 | #247 | Tragic 33.6% |
| Cree | 1.0 /100 | #248 | Tragic 33.6% |
| Immigrants | Liberia | 0.9 /100 | #249 | Tragic 33.5% |
| Indonesians | 0.9 /100 | #250 | Tragic 33.5% |