Hispanic or Latino vs Korean Child Poverty Under the Age of 5
COMPARE
Hispanic or Latino
Korean
Child Poverty Under the Age of 5
Child Poverty Under the Age of 5 Comparison
Hispanics or Latinos
Koreans
21.7%
CHILD POVERTY UNDER THE AGE OF 5
0.0/ 100
METRIC RATING
297th/ 347
METRIC RANK
14.4%
CHILD POVERTY UNDER THE AGE OF 5
99.8/ 100
METRIC RATING
31st/ 347
METRIC RANK
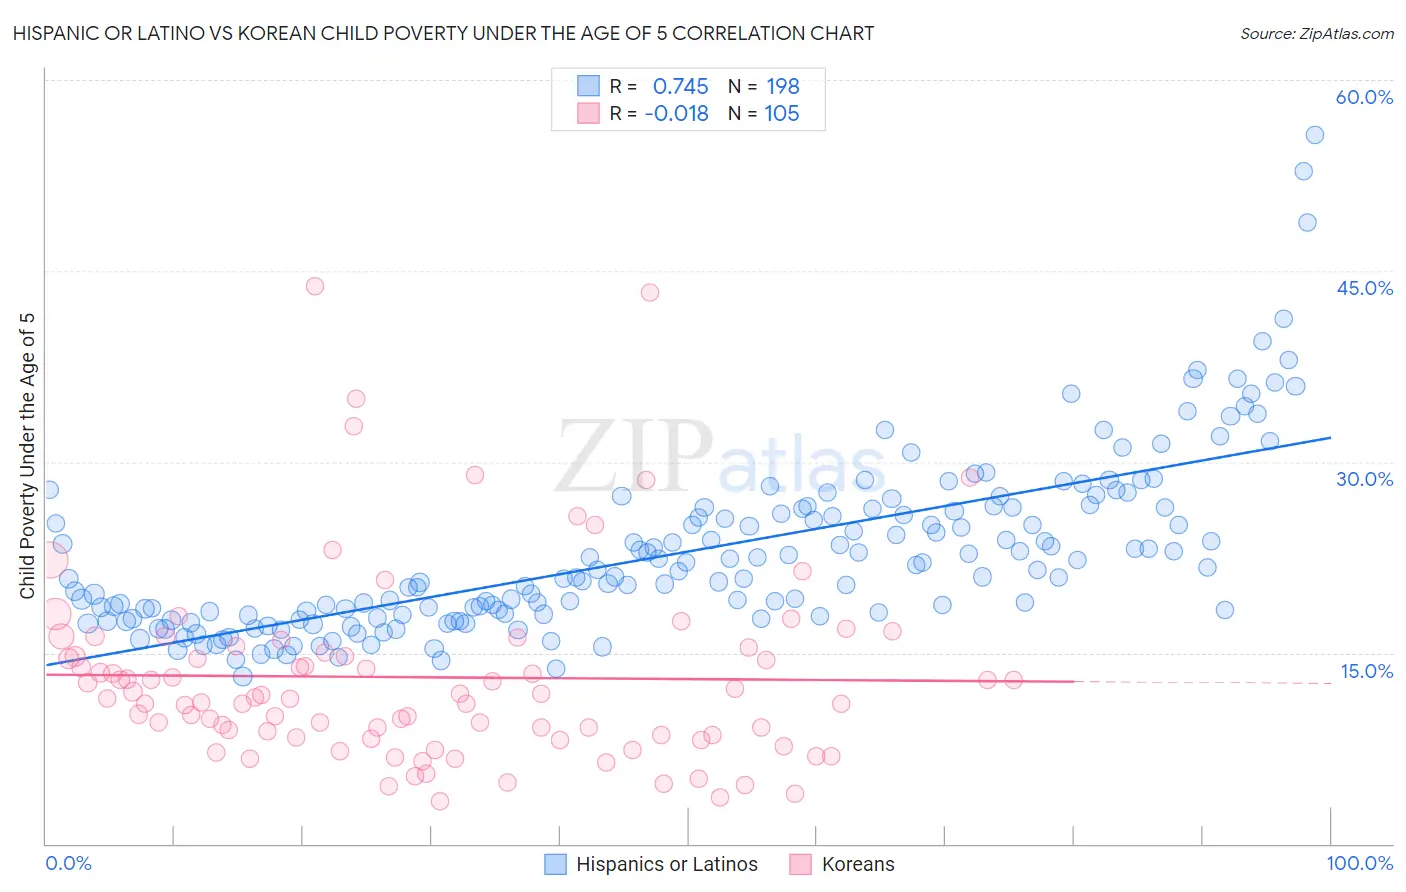
Hispanic or Latino vs Korean Child Poverty Under the Age of 5 Correlation Chart
The statistical analysis conducted on geographies consisting of 534,195,934 people shows a strong positive correlation between the proportion of Hispanics or Latinos and poverty level among children under the age of 5 in the United States with a correlation coefficient (R) of 0.745 and weighted average of 21.7%. Similarly, the statistical analysis conducted on geographies consisting of 483,948,585 people shows no correlation between the proportion of Koreans and poverty level among children under the age of 5 in the United States with a correlation coefficient (R) of -0.018 and weighted average of 14.4%, a difference of 50.9%.
Child Poverty Under the Age of 5 Correlation Summary
| Measurement | Hispanic or Latino | Korean |
| Minimum | 13.1% | 3.3% |
| Maximum | 55.6% | 43.8% |
| Range | 42.5% | 40.5% |
| Mean | 22.9% | 13.1% |
| Median | 21.0% | 11.4% |
| Interquartile 25% (IQ1) | 18.0% | 8.5% |
| Interquartile 75% (IQ3) | 26.3% | 15.2% |
| Interquartile Range (IQR) | 8.3% | 6.7% |
| Standard Deviation (Sample) | 6.9% | 7.5% |
| Standard Deviation (Population) | 6.9% | 7.5% |
Similar Demographics by Child Poverty Under the Age of 5
Demographics Similar to Hispanics or Latinos by Child Poverty Under the Age of 5
In terms of child poverty under the age of 5, the demographic groups most similar to Hispanics or Latinos are Yaqui (21.7%, a difference of 0.020%), Cherokee (21.7%, a difference of 0.17%), Blackfeet (21.8%, a difference of 0.39%), Chickasaw (21.8%, a difference of 0.39%), and Alaskan Athabascan (21.8%, a difference of 0.40%).
| Demographics | Rating | Rank | Child Poverty Under the Age of 5 |
| Immigrants | Caribbean | 0.0 /100 | #290 | Tragic 21.4% |
| British West Indians | 0.0 /100 | #291 | Tragic 21.4% |
| Immigrants | Somalia | 0.0 /100 | #292 | Tragic 21.6% |
| Mexicans | 0.0 /100 | #293 | Tragic 21.6% |
| Guatemalans | 0.0 /100 | #294 | Tragic 21.6% |
| Cherokee | 0.0 /100 | #295 | Tragic 21.7% |
| Yaqui | 0.0 /100 | #296 | Tragic 21.7% |
| Hispanics or Latinos | 0.0 /100 | #297 | Tragic 21.7% |
| Blackfeet | 0.0 /100 | #298 | Tragic 21.8% |
| Chickasaw | 0.0 /100 | #299 | Tragic 21.8% |
| Alaskan Athabascans | 0.0 /100 | #300 | Tragic 21.8% |
| Immigrants | Central America | 0.0 /100 | #301 | Tragic 22.0% |
| Iroquois | 0.0 /100 | #302 | Tragic 22.0% |
| Inupiat | 0.0 /100 | #303 | Tragic 22.0% |
| Immigrants | Guatemala | 0.0 /100 | #304 | Tragic 22.0% |
Demographics Similar to Koreans by Child Poverty Under the Age of 5
In terms of child poverty under the age of 5, the demographic groups most similar to Koreans are Cambodian (14.4%, a difference of 0.030%), Immigrants from Asia (14.4%, a difference of 0.080%), Immigrants from Sri Lanka (14.4%, a difference of 0.28%), Immigrants from Indonesia (14.3%, a difference of 0.47%), and Taiwanese (14.5%, a difference of 0.58%).
| Demographics | Rating | Rank | Child Poverty Under the Age of 5 |
| Asians | 99.9 /100 | #24 | Exceptional 14.0% |
| Cypriots | 99.9 /100 | #25 | Exceptional 14.0% |
| Immigrants | Lithuania | 99.9 /100 | #26 | Exceptional 14.1% |
| Tongans | 99.9 /100 | #27 | Exceptional 14.2% |
| Immigrants | Indonesia | 99.8 /100 | #28 | Exceptional 14.3% |
| Immigrants | Asia | 99.8 /100 | #29 | Exceptional 14.4% |
| Cambodians | 99.8 /100 | #30 | Exceptional 14.4% |
| Koreans | 99.8 /100 | #31 | Exceptional 14.4% |
| Immigrants | Sri Lanka | 99.8 /100 | #32 | Exceptional 14.4% |
| Taiwanese | 99.8 /100 | #33 | Exceptional 14.5% |
| Immigrants | Moldova | 99.8 /100 | #34 | Exceptional 14.5% |
| Latvians | 99.8 /100 | #35 | Exceptional 14.5% |
| Maltese | 99.8 /100 | #36 | Exceptional 14.5% |
| Turks | 99.7 /100 | #37 | Exceptional 14.6% |
| Eastern Europeans | 99.7 /100 | #38 | Exceptional 14.6% |