Hispanic or Latino vs Korean Poverty
COMPARE
Hispanic or Latino
Korean
Poverty
Poverty Comparison
Hispanics or Latinos
Koreans
15.3%
POVERTY
0.0/ 100
METRIC RATING
296th/ 347
METRIC RANK
10.9%
POVERTY
99.2/ 100
METRIC RATING
42nd/ 347
METRIC RANK
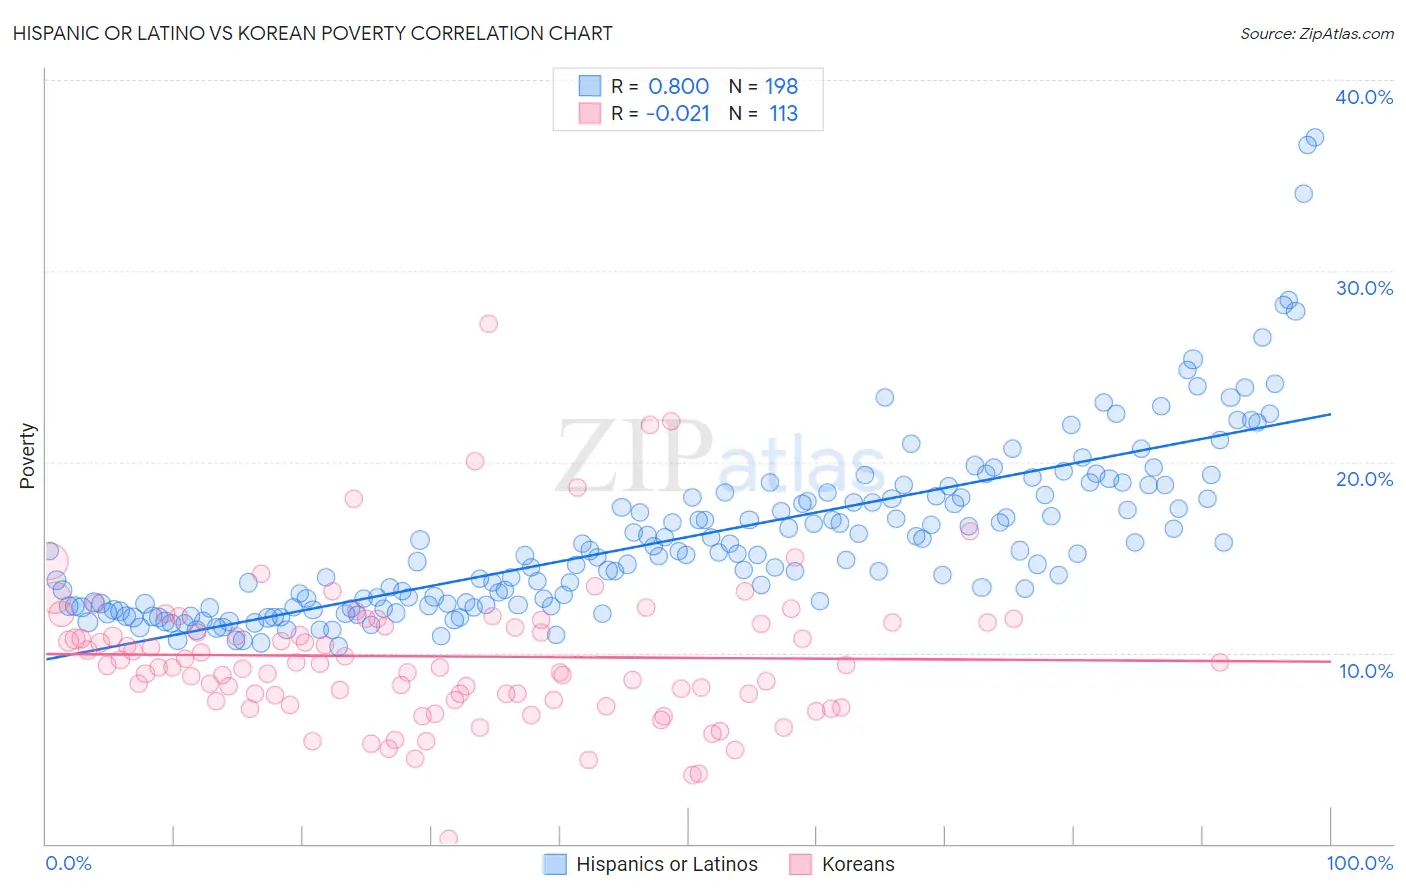
Hispanic or Latino vs Korean Poverty Correlation Chart
The statistical analysis conducted on geographies consisting of 574,490,073 people shows a very strong positive correlation between the proportion of Hispanics or Latinos and poverty level in the United States with a correlation coefficient (R) of 0.800 and weighted average of 15.3%. Similarly, the statistical analysis conducted on geographies consisting of 510,388,718 people shows no correlation between the proportion of Koreans and poverty level in the United States with a correlation coefficient (R) of -0.021 and weighted average of 10.9%, a difference of 40.2%.
Poverty Correlation Summary
| Measurement | Hispanic or Latino | Korean |
| Minimum | 10.3% | 0.27% |
| Maximum | 37.0% | 27.2% |
| Range | 26.7% | 27.0% |
| Mean | 16.0% | 9.8% |
| Median | 15.1% | 9.3% |
| Interquartile 25% (IQ1) | 12.5% | 7.5% |
| Interquartile 75% (IQ3) | 18.1% | 11.6% |
| Interquartile Range (IQR) | 5.6% | 4.0% |
| Standard Deviation (Sample) | 4.6% | 3.9% |
| Standard Deviation (Population) | 4.6% | 3.8% |
Similar Demographics by Poverty
Demographics Similar to Hispanics or Latinos by Poverty
In terms of poverty, the demographic groups most similar to Hispanics or Latinos are Guatemalan (15.3%, a difference of 0.010%), Immigrants from Bangladesh (15.3%, a difference of 0.050%), Immigrants from Senegal (15.3%, a difference of 0.19%), Senegalese (15.3%, a difference of 0.29%), and Blackfeet (15.2%, a difference of 0.43%).
| Demographics | Rating | Rank | Poverty |
| Immigrants | Belize | 0.0 /100 | #289 | Tragic 15.1% |
| Mexicans | 0.0 /100 | #290 | Tragic 15.1% |
| Immigrants | Cabo Verde | 0.0 /100 | #291 | Tragic 15.1% |
| Indonesians | 0.0 /100 | #292 | Tragic 15.1% |
| Immigrants | Zaire | 0.0 /100 | #293 | Tragic 15.1% |
| Blackfeet | 0.0 /100 | #294 | Tragic 15.2% |
| Guatemalans | 0.0 /100 | #295 | Tragic 15.3% |
| Hispanics or Latinos | 0.0 /100 | #296 | Tragic 15.3% |
| Immigrants | Bangladesh | 0.0 /100 | #297 | Tragic 15.3% |
| Immigrants | Senegal | 0.0 /100 | #298 | Tragic 15.3% |
| Senegalese | 0.0 /100 | #299 | Tragic 15.3% |
| Immigrants | Central America | 0.0 /100 | #300 | Tragic 15.4% |
| Bahamians | 0.0 /100 | #301 | Tragic 15.4% |
| Somalis | 0.0 /100 | #302 | Tragic 15.4% |
| Immigrants | Caribbean | 0.0 /100 | #303 | Tragic 15.5% |
Demographics Similar to Koreans by Poverty
In terms of poverty, the demographic groups most similar to Koreans are Immigrants from Singapore (10.9%, a difference of 0.050%), Immigrants from Moldova (10.9%, a difference of 0.19%), Immigrants from Iran (10.9%, a difference of 0.22%), Russian (10.9%, a difference of 0.31%), and Immigrants from Pakistan (10.8%, a difference of 0.36%).
| Demographics | Rating | Rank | Poverty |
| Tongans | 99.4 /100 | #35 | Exceptional 10.8% |
| Cypriots | 99.3 /100 | #36 | Exceptional 10.8% |
| Immigrants | Greece | 99.3 /100 | #37 | Exceptional 10.8% |
| Czechs | 99.3 /100 | #38 | Exceptional 10.8% |
| Immigrants | Pakistan | 99.3 /100 | #39 | Exceptional 10.8% |
| Russians | 99.3 /100 | #40 | Exceptional 10.9% |
| Immigrants | Iran | 99.2 /100 | #41 | Exceptional 10.9% |
| Koreans | 99.2 /100 | #42 | Exceptional 10.9% |
| Immigrants | Singapore | 99.2 /100 | #43 | Exceptional 10.9% |
| Immigrants | Moldova | 99.1 /100 | #44 | Exceptional 10.9% |
| Turks | 98.9 /100 | #45 | Exceptional 11.0% |
| Immigrants | Czechoslovakia | 98.9 /100 | #46 | Exceptional 11.0% |
| Immigrants | Romania | 98.9 /100 | #47 | Exceptional 11.0% |
| Slovenes | 98.9 /100 | #48 | Exceptional 11.0% |
| Immigrants | Japan | 98.9 /100 | #49 | Exceptional 11.0% |