Guyanese vs Bhutanese Single Female Poverty
COMPARE
Guyanese
Bhutanese
Single Female Poverty
Single Female Poverty Comparison
Guyanese
Bhutanese
21.0%
SINGLE FEMALE POVERTY
52.0/ 100
METRIC RATING
172nd/ 347
METRIC RANK
17.7%
SINGLE FEMALE POVERTY
100.0/ 100
METRIC RATING
9th/ 347
METRIC RANK
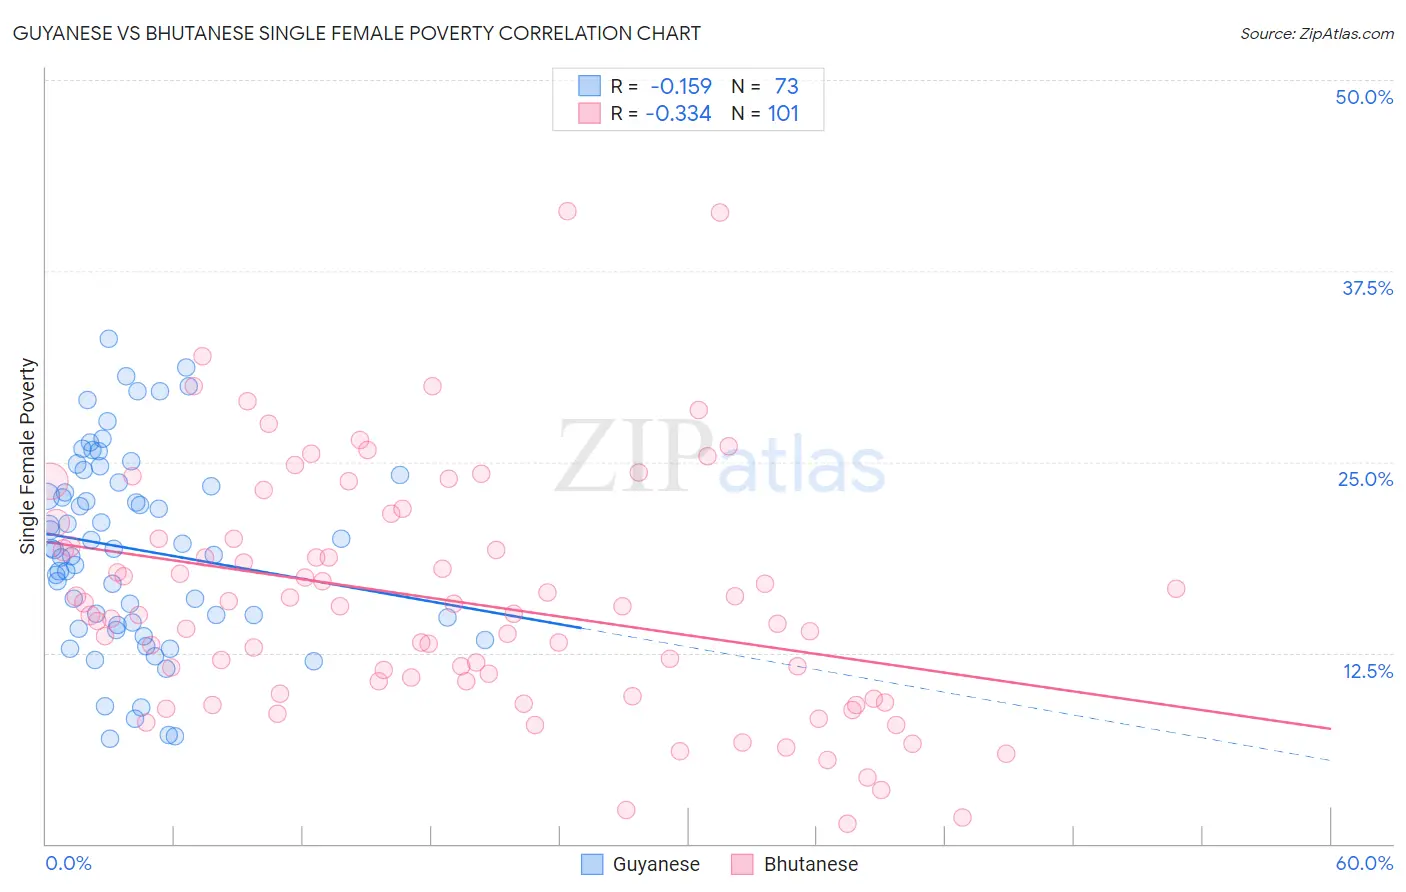
Guyanese vs Bhutanese Single Female Poverty Correlation Chart
The statistical analysis conducted on geographies consisting of 175,255,160 people shows a poor negative correlation between the proportion of Guyanese and poverty level among single females in the United States with a correlation coefficient (R) of -0.159 and weighted average of 21.0%. Similarly, the statistical analysis conducted on geographies consisting of 446,564,428 people shows a mild negative correlation between the proportion of Bhutanese and poverty level among single females in the United States with a correlation coefficient (R) of -0.334 and weighted average of 17.7%, a difference of 18.5%.
Single Female Poverty Correlation Summary
| Measurement | Guyanese | Bhutanese |
| Minimum | 6.8% | 1.3% |
| Maximum | 33.1% | 41.4% |
| Range | 26.2% | 40.1% |
| Mean | 19.3% | 15.9% |
| Median | 19.3% | 15.1% |
| Interquartile 25% (IQ1) | 14.4% | 10.2% |
| Interquartile 75% (IQ3) | 23.9% | 19.9% |
| Interquartile Range (IQR) | 9.5% | 9.7% |
| Standard Deviation (Sample) | 6.3% | 7.8% |
| Standard Deviation (Population) | 6.3% | 7.8% |
Similar Demographics by Single Female Poverty
Demographics Similar to Guyanese by Single Female Poverty
In terms of single female poverty, the demographic groups most similar to Guyanese are Moroccan (21.0%, a difference of 0.050%), New Zealander (21.0%, a difference of 0.070%), Immigrants from Guyana (21.0%, a difference of 0.090%), Cuban (21.0%, a difference of 0.13%), and Immigrants from Trinidad and Tobago (20.9%, a difference of 0.27%).
| Demographics | Rating | Rank | Single Female Poverty |
| Ugandans | 64.0 /100 | #165 | Good 20.8% |
| Norwegians | 63.0 /100 | #166 | Good 20.8% |
| Immigrants | Norway | 63.0 /100 | #167 | Good 20.8% |
| Immigrants | Costa Rica | 61.5 /100 | #168 | Good 20.9% |
| Immigrants | Trinidad and Tobago | 56.3 /100 | #169 | Average 20.9% |
| New Zealanders | 53.2 /100 | #170 | Average 21.0% |
| Moroccans | 52.8 /100 | #171 | Average 21.0% |
| Guyanese | 52.0 /100 | #172 | Average 21.0% |
| Immigrants | Guyana | 50.6 /100 | #173 | Average 21.0% |
| Cubans | 50.0 /100 | #174 | Average 21.0% |
| Czechs | 46.8 /100 | #175 | Average 21.0% |
| Canadians | 45.4 /100 | #176 | Average 21.1% |
| Scandinavians | 45.2 /100 | #177 | Average 21.1% |
| Immigrants | Bosnia and Herzegovina | 44.9 /100 | #178 | Average 21.1% |
| British | 42.9 /100 | #179 | Average 21.1% |
Demographics Similar to Bhutanese by Single Female Poverty
In terms of single female poverty, the demographic groups most similar to Bhutanese are Immigrants from Ireland (17.8%, a difference of 0.41%), Immigrants from Lithuania (17.8%, a difference of 0.50%), Immigrants from South Central Asia (17.8%, a difference of 0.56%), Immigrants from Bolivia (17.8%, a difference of 0.82%), and Bolivian (17.9%, a difference of 1.3%).
| Demographics | Rating | Rank | Single Female Poverty |
| Immigrants | Taiwan | 100.0 /100 | #2 | Exceptional 16.4% |
| Immigrants | Hong Kong | 100.0 /100 | #3 | Exceptional 16.5% |
| Immigrants | India | 100.0 /100 | #4 | Exceptional 16.8% |
| Assyrians/Chaldeans/Syriacs | 100.0 /100 | #5 | Exceptional 17.0% |
| Filipinos | 100.0 /100 | #6 | Exceptional 17.0% |
| Thais | 100.0 /100 | #7 | Exceptional 17.3% |
| Immigrants | Iran | 100.0 /100 | #8 | Exceptional 17.5% |
| Bhutanese | 100.0 /100 | #9 | Exceptional 17.7% |
| Immigrants | Ireland | 100.0 /100 | #10 | Exceptional 17.8% |
| Immigrants | Lithuania | 100.0 /100 | #11 | Exceptional 17.8% |
| Immigrants | South Central Asia | 100.0 /100 | #12 | Exceptional 17.8% |
| Immigrants | Bolivia | 100.0 /100 | #13 | Exceptional 17.8% |
| Bolivians | 100.0 /100 | #14 | Exceptional 17.9% |
| Indians (Asian) | 100.0 /100 | #15 | Exceptional 17.9% |
| Iranians | 100.0 /100 | #16 | Exceptional 18.0% |