Guyanese vs Immigrants from Zaire Single Female Poverty
COMPARE
Guyanese
Immigrants from Zaire
Single Female Poverty
Single Female Poverty Comparison
Guyanese
Immigrants from Zaire
21.0%
SINGLE FEMALE POVERTY
52.0/ 100
METRIC RATING
172nd/ 347
METRIC RANK
23.8%
SINGLE FEMALE POVERTY
0.0/ 100
METRIC RATING
281st/ 347
METRIC RANK
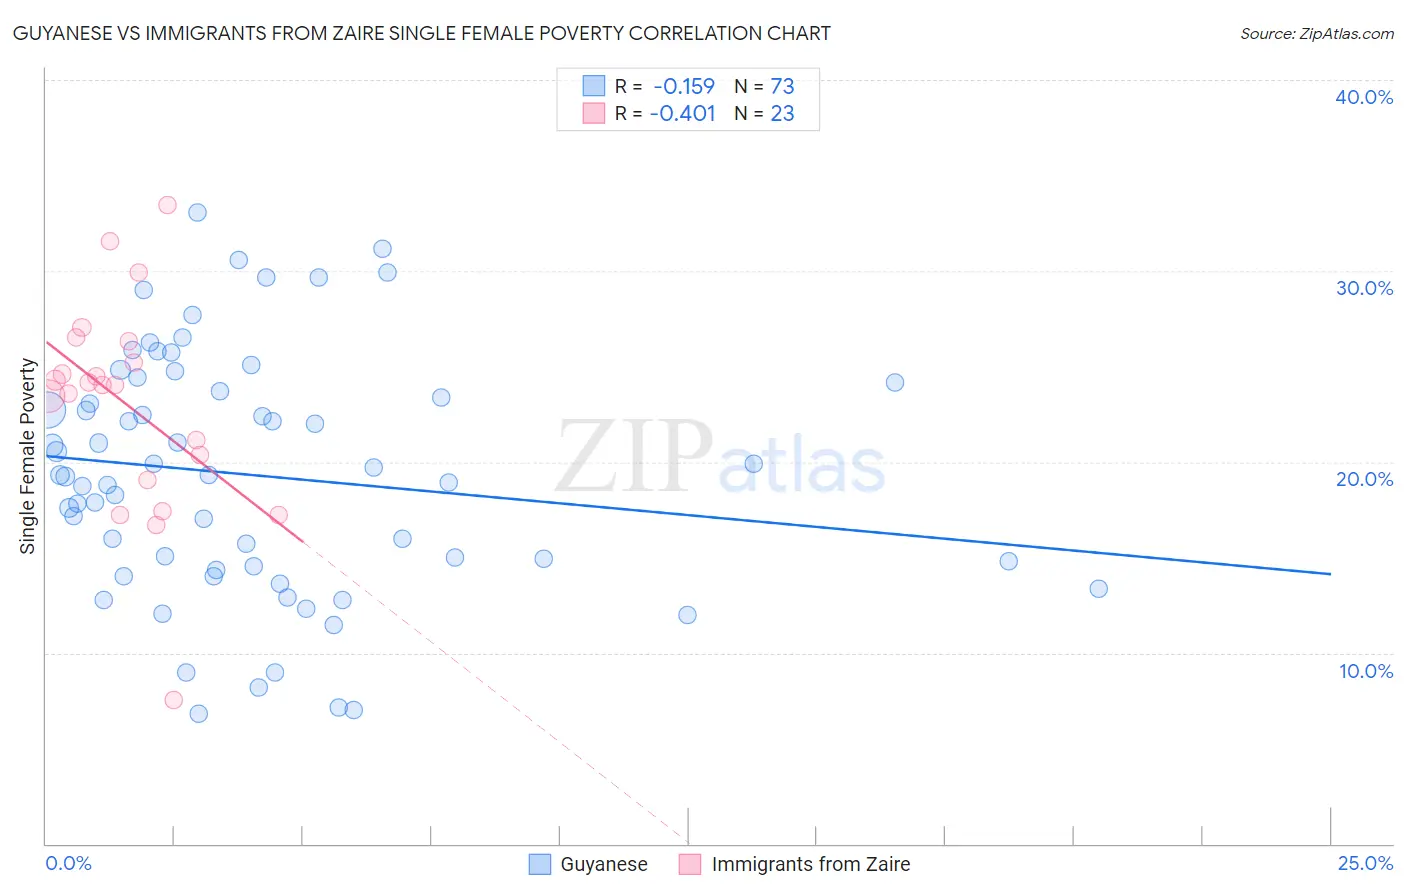
Guyanese vs Immigrants from Zaire Single Female Poverty Correlation Chart
The statistical analysis conducted on geographies consisting of 175,255,160 people shows a poor negative correlation between the proportion of Guyanese and poverty level among single females in the United States with a correlation coefficient (R) of -0.159 and weighted average of 21.0%. Similarly, the statistical analysis conducted on geographies consisting of 106,941,709 people shows a moderate negative correlation between the proportion of Immigrants from Zaire and poverty level among single females in the United States with a correlation coefficient (R) of -0.401 and weighted average of 23.8%, a difference of 13.6%.
Single Female Poverty Correlation Summary
| Measurement | Guyanese | Immigrants from Zaire |
| Minimum | 6.8% | 7.5% |
| Maximum | 33.1% | 33.4% |
| Range | 26.2% | 25.9% |
| Mean | 19.3% | 23.0% |
| Median | 19.3% | 24.0% |
| Interquartile 25% (IQ1) | 14.4% | 19.0% |
| Interquartile 75% (IQ3) | 23.9% | 26.3% |
| Interquartile Range (IQR) | 9.5% | 7.3% |
| Standard Deviation (Sample) | 6.3% | 5.6% |
| Standard Deviation (Population) | 6.3% | 5.5% |
Similar Demographics by Single Female Poverty
Demographics Similar to Guyanese by Single Female Poverty
In terms of single female poverty, the demographic groups most similar to Guyanese are Moroccan (21.0%, a difference of 0.050%), New Zealander (21.0%, a difference of 0.070%), Immigrants from Guyana (21.0%, a difference of 0.090%), Cuban (21.0%, a difference of 0.13%), and Immigrants from Trinidad and Tobago (20.9%, a difference of 0.27%).
| Demographics | Rating | Rank | Single Female Poverty |
| Ugandans | 64.0 /100 | #165 | Good 20.8% |
| Norwegians | 63.0 /100 | #166 | Good 20.8% |
| Immigrants | Norway | 63.0 /100 | #167 | Good 20.8% |
| Immigrants | Costa Rica | 61.5 /100 | #168 | Good 20.9% |
| Immigrants | Trinidad and Tobago | 56.3 /100 | #169 | Average 20.9% |
| New Zealanders | 53.2 /100 | #170 | Average 21.0% |
| Moroccans | 52.8 /100 | #171 | Average 21.0% |
| Guyanese | 52.0 /100 | #172 | Average 21.0% |
| Immigrants | Guyana | 50.6 /100 | #173 | Average 21.0% |
| Cubans | 50.0 /100 | #174 | Average 21.0% |
| Czechs | 46.8 /100 | #175 | Average 21.0% |
| Canadians | 45.4 /100 | #176 | Average 21.1% |
| Scandinavians | 45.2 /100 | #177 | Average 21.1% |
| Immigrants | Bosnia and Herzegovina | 44.9 /100 | #178 | Average 21.1% |
| British | 42.9 /100 | #179 | Average 21.1% |
Demographics Similar to Immigrants from Zaire by Single Female Poverty
In terms of single female poverty, the demographic groups most similar to Immigrants from Zaire are Guatemalan (23.8%, a difference of 0.050%), German Russian (23.9%, a difference of 0.20%), Immigrants from Dominica (23.9%, a difference of 0.31%), Immigrants from Latin America (23.7%, a difference of 0.51%), and Alaskan Athabascan (23.6%, a difference of 1.0%).
| Demographics | Rating | Rank | Single Female Poverty |
| Marshallese | 0.1 /100 | #274 | Tragic 23.3% |
| Mexican American Indians | 0.1 /100 | #275 | Tragic 23.4% |
| Immigrants | Azores | 0.0 /100 | #276 | Tragic 23.5% |
| Pennsylvania Germans | 0.0 /100 | #277 | Tragic 23.6% |
| Immigrants | Nonimmigrants | 0.0 /100 | #278 | Tragic 23.6% |
| Alaskan Athabascans | 0.0 /100 | #279 | Tragic 23.6% |
| Immigrants | Latin America | 0.0 /100 | #280 | Tragic 23.7% |
| Immigrants | Zaire | 0.0 /100 | #281 | Tragic 23.8% |
| Guatemalans | 0.0 /100 | #282 | Tragic 23.8% |
| German Russians | 0.0 /100 | #283 | Tragic 23.9% |
| Immigrants | Dominica | 0.0 /100 | #284 | Tragic 23.9% |
| Immigrants | Guatemala | 0.0 /100 | #285 | Tragic 24.1% |
| Cree | 0.0 /100 | #286 | Tragic 24.1% |
| Bangladeshis | 0.0 /100 | #287 | Tragic 24.2% |
| Spanish Americans | 0.0 /100 | #288 | Tragic 24.2% |