Guyanese vs Immigrants from Serbia Single Female Poverty
COMPARE
Guyanese
Immigrants from Serbia
Single Female Poverty
Single Female Poverty Comparison
Guyanese
Immigrants from Serbia
21.0%
SINGLE FEMALE POVERTY
52.0/ 100
METRIC RATING
172nd/ 347
METRIC RANK
18.8%
SINGLE FEMALE POVERTY
99.9/ 100
METRIC RATING
41st/ 347
METRIC RANK
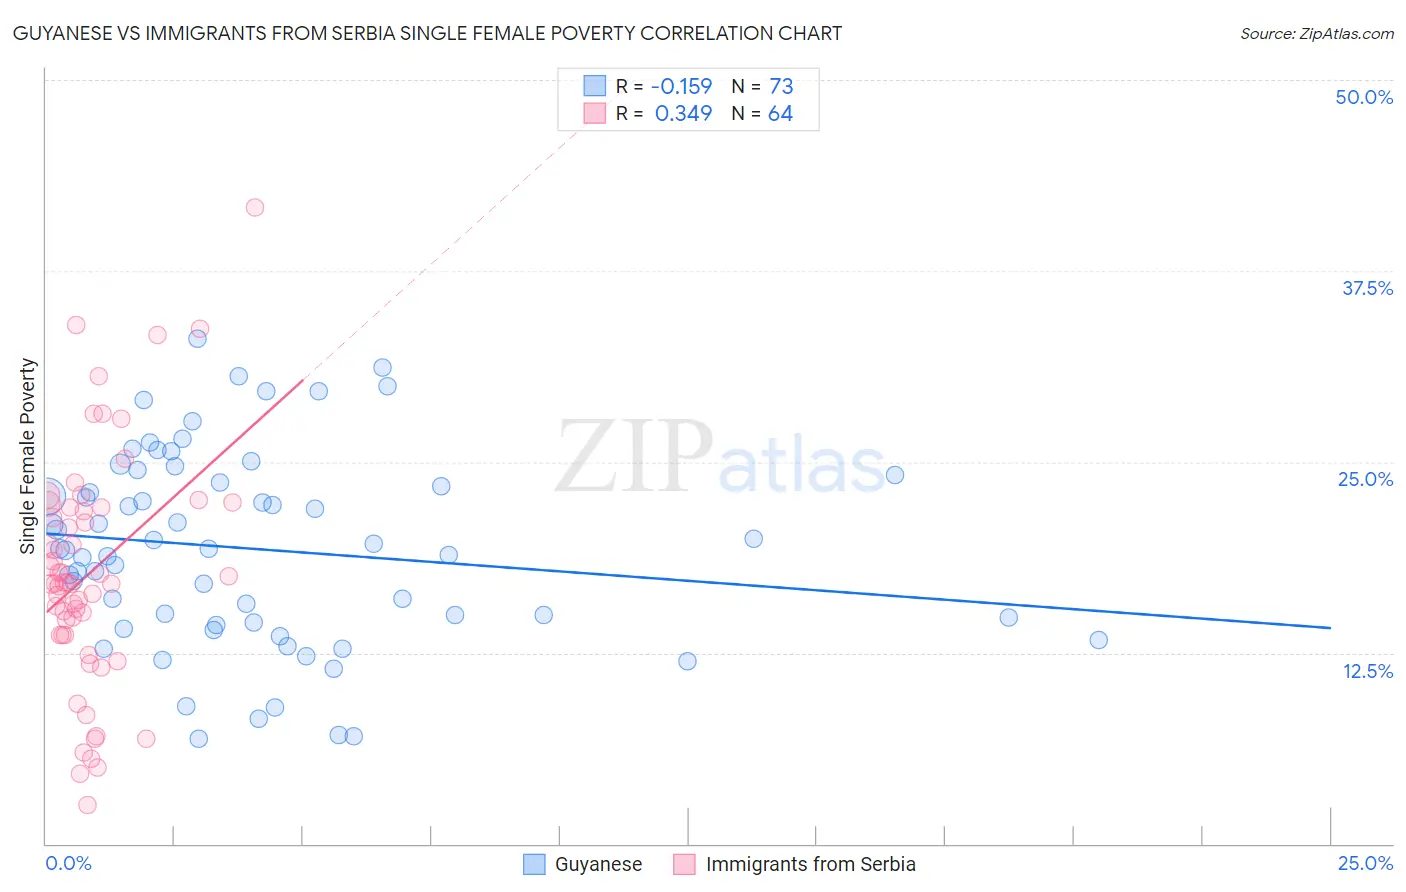
Guyanese vs Immigrants from Serbia Single Female Poverty Correlation Chart
The statistical analysis conducted on geographies consisting of 175,255,160 people shows a poor negative correlation between the proportion of Guyanese and poverty level among single females in the United States with a correlation coefficient (R) of -0.159 and weighted average of 21.0%. Similarly, the statistical analysis conducted on geographies consisting of 130,863,252 people shows a mild positive correlation between the proportion of Immigrants from Serbia and poverty level among single females in the United States with a correlation coefficient (R) of 0.349 and weighted average of 18.8%, a difference of 11.6%.
Single Female Poverty Correlation Summary
| Measurement | Guyanese | Immigrants from Serbia |
| Minimum | 6.8% | 2.5% |
| Maximum | 33.1% | 41.7% |
| Range | 26.2% | 39.1% |
| Mean | 19.3% | 17.8% |
| Median | 19.3% | 17.1% |
| Interquartile 25% (IQ1) | 14.4% | 13.7% |
| Interquartile 75% (IQ3) | 23.9% | 22.0% |
| Interquartile Range (IQR) | 9.5% | 8.4% |
| Standard Deviation (Sample) | 6.3% | 7.7% |
| Standard Deviation (Population) | 6.3% | 7.6% |
Similar Demographics by Single Female Poverty
Demographics Similar to Guyanese by Single Female Poverty
In terms of single female poverty, the demographic groups most similar to Guyanese are Moroccan (21.0%, a difference of 0.050%), New Zealander (21.0%, a difference of 0.070%), Immigrants from Guyana (21.0%, a difference of 0.090%), Cuban (21.0%, a difference of 0.13%), and Immigrants from Trinidad and Tobago (20.9%, a difference of 0.27%).
| Demographics | Rating | Rank | Single Female Poverty |
| Ugandans | 64.0 /100 | #165 | Good 20.8% |
| Norwegians | 63.0 /100 | #166 | Good 20.8% |
| Immigrants | Norway | 63.0 /100 | #167 | Good 20.8% |
| Immigrants | Costa Rica | 61.5 /100 | #168 | Good 20.9% |
| Immigrants | Trinidad and Tobago | 56.3 /100 | #169 | Average 20.9% |
| New Zealanders | 53.2 /100 | #170 | Average 21.0% |
| Moroccans | 52.8 /100 | #171 | Average 21.0% |
| Guyanese | 52.0 /100 | #172 | Average 21.0% |
| Immigrants | Guyana | 50.6 /100 | #173 | Average 21.0% |
| Cubans | 50.0 /100 | #174 | Average 21.0% |
| Czechs | 46.8 /100 | #175 | Average 21.0% |
| Canadians | 45.4 /100 | #176 | Average 21.1% |
| Scandinavians | 45.2 /100 | #177 | Average 21.1% |
| Immigrants | Bosnia and Herzegovina | 44.9 /100 | #178 | Average 21.1% |
| British | 42.9 /100 | #179 | Average 21.1% |
Demographics Similar to Immigrants from Serbia by Single Female Poverty
In terms of single female poverty, the demographic groups most similar to Immigrants from Serbia are Okinawan (18.8%, a difference of 0.020%), Bulgarian (18.8%, a difference of 0.050%), Tongan (18.8%, a difference of 0.080%), Jordanian (18.8%, a difference of 0.080%), and Immigrants from Romania (18.8%, a difference of 0.23%).
| Demographics | Rating | Rank | Single Female Poverty |
| Koreans | 99.9 /100 | #34 | Exceptional 18.6% |
| Immigrants | Japan | 99.9 /100 | #35 | Exceptional 18.6% |
| Turks | 99.9 /100 | #36 | Exceptional 18.7% |
| Immigrants | Armenia | 99.9 /100 | #37 | Exceptional 18.7% |
| Tongans | 99.9 /100 | #38 | Exceptional 18.8% |
| Bulgarians | 99.9 /100 | #39 | Exceptional 18.8% |
| Okinawans | 99.9 /100 | #40 | Exceptional 18.8% |
| Immigrants | Serbia | 99.9 /100 | #41 | Exceptional 18.8% |
| Jordanians | 99.9 /100 | #42 | Exceptional 18.8% |
| Immigrants | Romania | 99.9 /100 | #43 | Exceptional 18.8% |
| Immigrants | Croatia | 99.9 /100 | #44 | Exceptional 18.9% |
| Immigrants | Indonesia | 99.8 /100 | #45 | Exceptional 18.9% |
| Macedonians | 99.8 /100 | #46 | Exceptional 18.9% |
| Latvians | 99.8 /100 | #47 | Exceptional 19.0% |
| Immigrants | Argentina | 99.8 /100 | #48 | Exceptional 19.0% |