Guyanese vs Cape Verdean Single Female Poverty
COMPARE
Guyanese
Cape Verdean
Single Female Poverty
Single Female Poverty Comparison
Guyanese
Cape Verdeans
21.0%
SINGLE FEMALE POVERTY
52.0/ 100
METRIC RATING
172nd/ 347
METRIC RANK
22.3%
SINGLE FEMALE POVERTY
2.1/ 100
METRIC RATING
241st/ 347
METRIC RANK
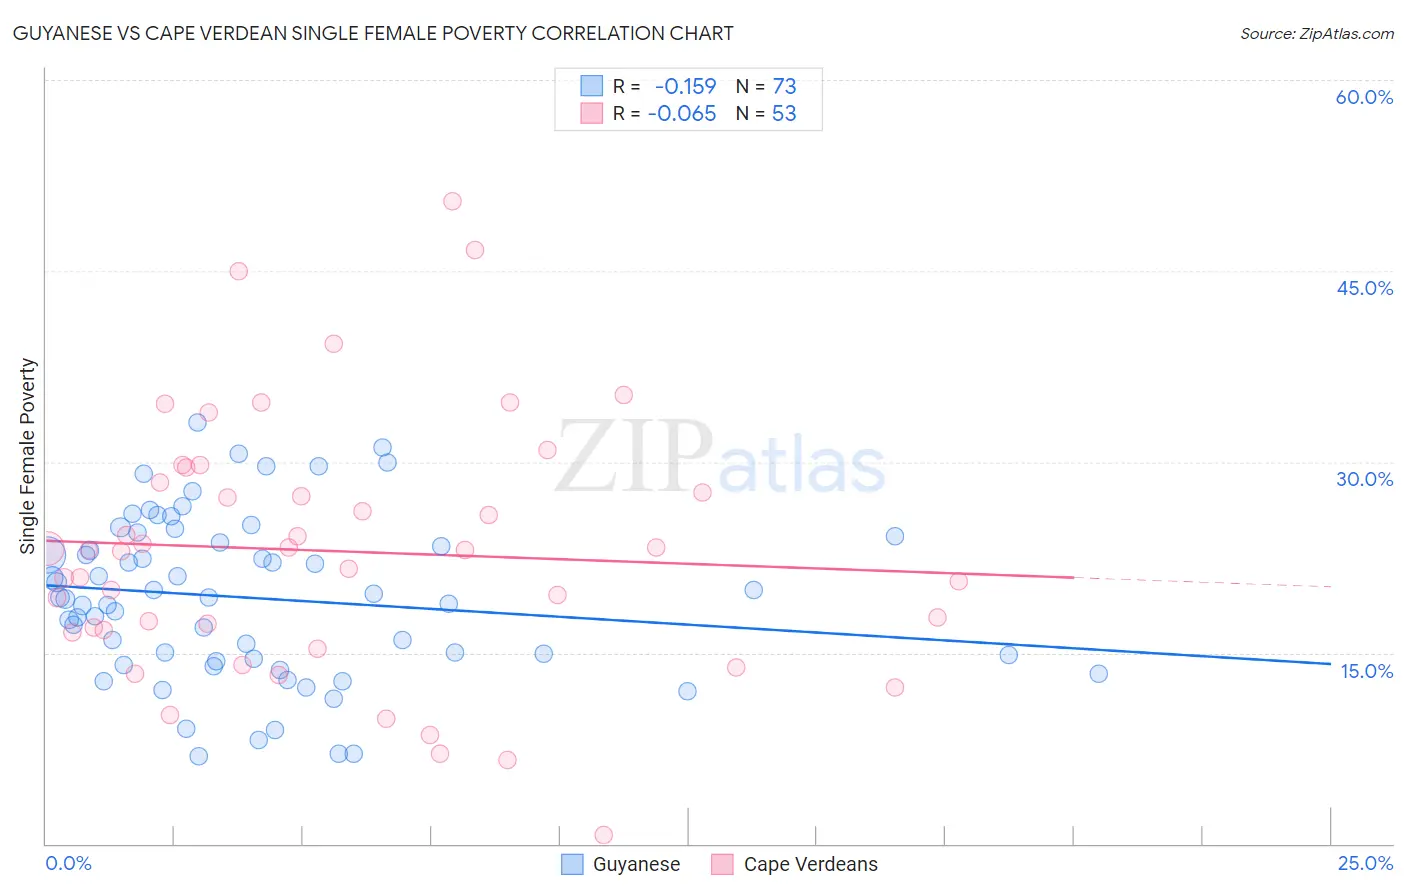
Guyanese vs Cape Verdean Single Female Poverty Correlation Chart
The statistical analysis conducted on geographies consisting of 175,255,160 people shows a poor negative correlation between the proportion of Guyanese and poverty level among single females in the United States with a correlation coefficient (R) of -0.159 and weighted average of 21.0%. Similarly, the statistical analysis conducted on geographies consisting of 107,029,522 people shows a slight negative correlation between the proportion of Cape Verdeans and poverty level among single females in the United States with a correlation coefficient (R) of -0.065 and weighted average of 22.3%, a difference of 6.1%.
Single Female Poverty Correlation Summary
| Measurement | Guyanese | Cape Verdean |
| Minimum | 6.8% | 0.66% |
| Maximum | 33.1% | 50.5% |
| Range | 26.2% | 49.8% |
| Mean | 19.3% | 23.0% |
| Median | 19.3% | 23.1% |
| Interquartile 25% (IQ1) | 14.4% | 16.7% |
| Interquartile 75% (IQ3) | 23.9% | 28.9% |
| Interquartile Range (IQR) | 9.5% | 12.2% |
| Standard Deviation (Sample) | 6.3% | 10.2% |
| Standard Deviation (Population) | 6.3% | 10.1% |
Similar Demographics by Single Female Poverty
Demographics Similar to Guyanese by Single Female Poverty
In terms of single female poverty, the demographic groups most similar to Guyanese are Moroccan (21.0%, a difference of 0.050%), New Zealander (21.0%, a difference of 0.070%), Immigrants from Guyana (21.0%, a difference of 0.090%), Cuban (21.0%, a difference of 0.13%), and Immigrants from Trinidad and Tobago (20.9%, a difference of 0.27%).
| Demographics | Rating | Rank | Single Female Poverty |
| Ugandans | 64.0 /100 | #165 | Good 20.8% |
| Norwegians | 63.0 /100 | #166 | Good 20.8% |
| Immigrants | Norway | 63.0 /100 | #167 | Good 20.8% |
| Immigrants | Costa Rica | 61.5 /100 | #168 | Good 20.9% |
| Immigrants | Trinidad and Tobago | 56.3 /100 | #169 | Average 20.9% |
| New Zealanders | 53.2 /100 | #170 | Average 21.0% |
| Moroccans | 52.8 /100 | #171 | Average 21.0% |
| Guyanese | 52.0 /100 | #172 | Average 21.0% |
| Immigrants | Guyana | 50.6 /100 | #173 | Average 21.0% |
| Cubans | 50.0 /100 | #174 | Average 21.0% |
| Czechs | 46.8 /100 | #175 | Average 21.0% |
| Canadians | 45.4 /100 | #176 | Average 21.1% |
| Scandinavians | 45.2 /100 | #177 | Average 21.1% |
| Immigrants | Bosnia and Herzegovina | 44.9 /100 | #178 | Average 21.1% |
| British | 42.9 /100 | #179 | Average 21.1% |
Demographics Similar to Cape Verdeans by Single Female Poverty
In terms of single female poverty, the demographic groups most similar to Cape Verdeans are Bermudan (22.3%, a difference of 0.070%), French (22.2%, a difference of 0.14%), West Indian (22.3%, a difference of 0.16%), Immigrants from Middle Africa (22.3%, a difference of 0.17%), and Immigrants from Bangladesh (22.3%, a difference of 0.21%).
| Demographics | Rating | Rank | Single Female Poverty |
| Spanish | 4.7 /100 | #234 | Tragic 22.0% |
| Dutch | 4.6 /100 | #235 | Tragic 22.0% |
| Immigrants | Ecuador | 4.2 /100 | #236 | Tragic 22.0% |
| Vietnamese | 4.0 /100 | #237 | Tragic 22.0% |
| French Canadians | 2.8 /100 | #238 | Tragic 22.2% |
| Malaysians | 2.8 /100 | #239 | Tragic 22.2% |
| French | 2.3 /100 | #240 | Tragic 22.2% |
| Cape Verdeans | 2.1 /100 | #241 | Tragic 22.3% |
| Bermudans | 2.0 /100 | #242 | Tragic 22.3% |
| West Indians | 1.9 /100 | #243 | Tragic 22.3% |
| Immigrants | Middle Africa | 1.9 /100 | #244 | Tragic 22.3% |
| Immigrants | Bangladesh | 1.8 /100 | #245 | Tragic 22.3% |
| Liberians | 1.4 /100 | #246 | Tragic 22.4% |
| Immigrants | El Salvador | 1.4 /100 | #247 | Tragic 22.4% |
| Belizeans | 1.4 /100 | #248 | Tragic 22.4% |