Guyanese vs Immigrants from Cameroon Single Female Poverty
COMPARE
Guyanese
Immigrants from Cameroon
Single Female Poverty
Single Female Poverty Comparison
Guyanese
Immigrants from Cameroon
21.0%
SINGLE FEMALE POVERTY
52.0/ 100
METRIC RATING
172nd/ 347
METRIC RANK
19.8%
SINGLE FEMALE POVERTY
97.3/ 100
METRIC RATING
102nd/ 347
METRIC RANK
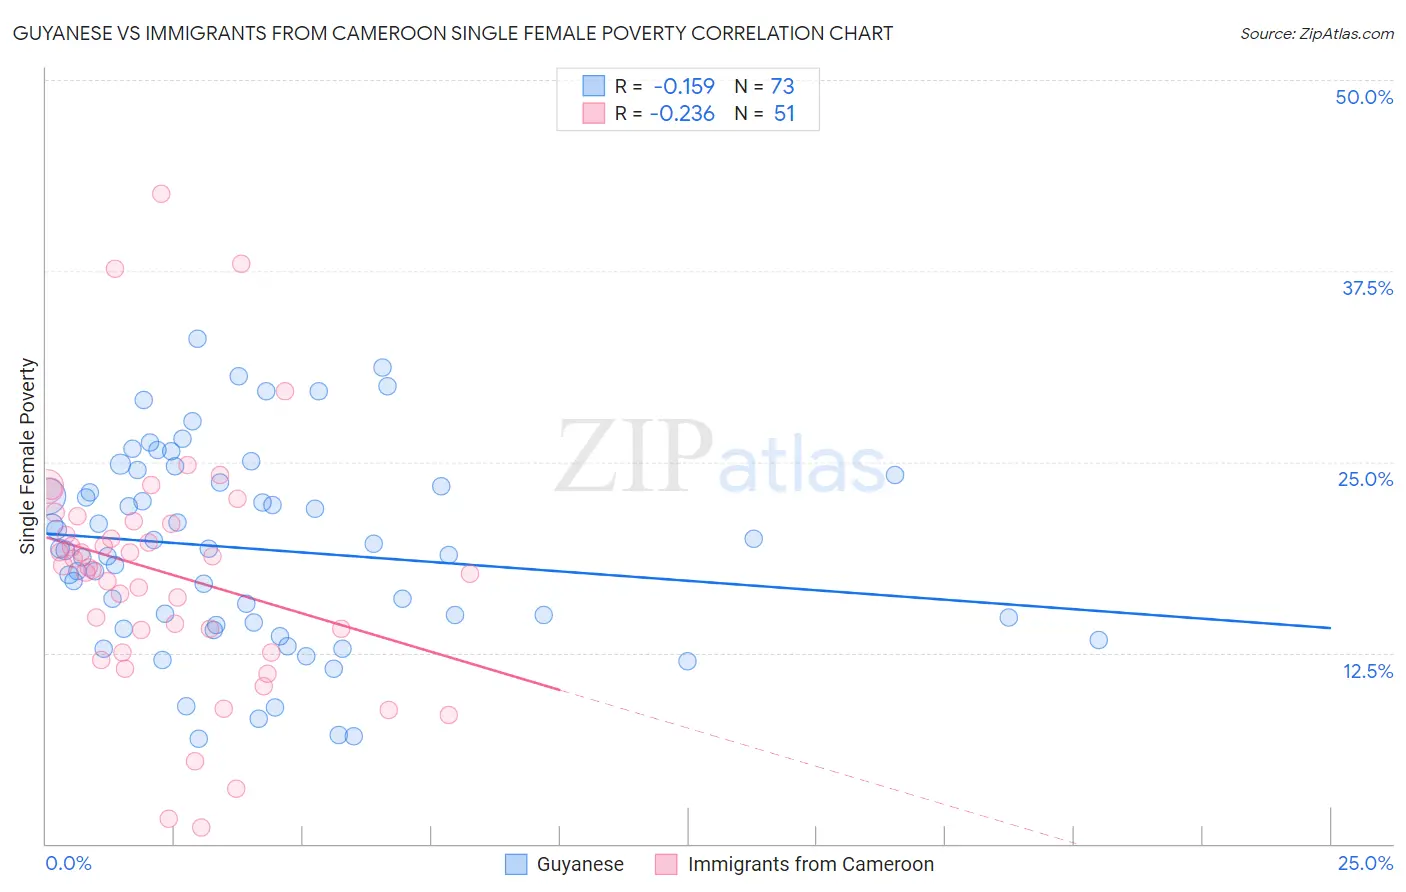
Guyanese vs Immigrants from Cameroon Single Female Poverty Correlation Chart
The statistical analysis conducted on geographies consisting of 175,255,160 people shows a poor negative correlation between the proportion of Guyanese and poverty level among single females in the United States with a correlation coefficient (R) of -0.159 and weighted average of 21.0%. Similarly, the statistical analysis conducted on geographies consisting of 130,300,683 people shows a weak negative correlation between the proportion of Immigrants from Cameroon and poverty level among single females in the United States with a correlation coefficient (R) of -0.236 and weighted average of 19.8%, a difference of 5.8%.
Single Female Poverty Correlation Summary
| Measurement | Guyanese | Immigrants from Cameroon |
| Minimum | 6.8% | 1.1% |
| Maximum | 33.1% | 42.6% |
| Range | 26.2% | 41.5% |
| Mean | 19.3% | 17.7% |
| Median | 19.3% | 18.1% |
| Interquartile 25% (IQ1) | 14.4% | 12.5% |
| Interquartile 75% (IQ3) | 23.9% | 21.1% |
| Interquartile Range (IQR) | 9.5% | 8.5% |
| Standard Deviation (Sample) | 6.3% | 8.1% |
| Standard Deviation (Population) | 6.3% | 8.0% |
Similar Demographics by Single Female Poverty
Demographics Similar to Guyanese by Single Female Poverty
In terms of single female poverty, the demographic groups most similar to Guyanese are Moroccan (21.0%, a difference of 0.050%), New Zealander (21.0%, a difference of 0.070%), Immigrants from Guyana (21.0%, a difference of 0.090%), Cuban (21.0%, a difference of 0.13%), and Immigrants from Trinidad and Tobago (20.9%, a difference of 0.27%).
| Demographics | Rating | Rank | Single Female Poverty |
| Ugandans | 64.0 /100 | #165 | Good 20.8% |
| Norwegians | 63.0 /100 | #166 | Good 20.8% |
| Immigrants | Norway | 63.0 /100 | #167 | Good 20.8% |
| Immigrants | Costa Rica | 61.5 /100 | #168 | Good 20.9% |
| Immigrants | Trinidad and Tobago | 56.3 /100 | #169 | Average 20.9% |
| New Zealanders | 53.2 /100 | #170 | Average 21.0% |
| Moroccans | 52.8 /100 | #171 | Average 21.0% |
| Guyanese | 52.0 /100 | #172 | Average 21.0% |
| Immigrants | Guyana | 50.6 /100 | #173 | Average 21.0% |
| Cubans | 50.0 /100 | #174 | Average 21.0% |
| Czechs | 46.8 /100 | #175 | Average 21.0% |
| Canadians | 45.4 /100 | #176 | Average 21.1% |
| Scandinavians | 45.2 /100 | #177 | Average 21.1% |
| Immigrants | Bosnia and Herzegovina | 44.9 /100 | #178 | Average 21.1% |
| British | 42.9 /100 | #179 | Average 21.1% |
Demographics Similar to Immigrants from Cameroon by Single Female Poverty
In terms of single female poverty, the demographic groups most similar to Immigrants from Cameroon are Immigrants from Belgium (19.8%, a difference of 0.010%), Immigrants from Southern Europe (19.9%, a difference of 0.12%), Ukrainian (19.8%, a difference of 0.19%), Chilean (19.9%, a difference of 0.24%), and Israeli (19.9%, a difference of 0.25%).
| Demographics | Rating | Rank | Single Female Poverty |
| Estonians | 98.2 /100 | #95 | Exceptional 19.7% |
| Immigrants | Brazil | 98.2 /100 | #96 | Exceptional 19.7% |
| Croatians | 98.1 /100 | #97 | Exceptional 19.7% |
| Immigrants | France | 97.9 /100 | #98 | Exceptional 19.7% |
| Sierra Leoneans | 97.9 /100 | #99 | Exceptional 19.7% |
| Ukrainians | 97.6 /100 | #100 | Exceptional 19.8% |
| Immigrants | Belgium | 97.3 /100 | #101 | Exceptional 19.8% |
| Immigrants | Cameroon | 97.3 /100 | #102 | Exceptional 19.8% |
| Immigrants | Southern Europe | 97.1 /100 | #103 | Exceptional 19.9% |
| Chileans | 96.9 /100 | #104 | Exceptional 19.9% |
| Israelis | 96.9 /100 | #105 | Exceptional 19.9% |
| Ethiopians | 96.7 /100 | #106 | Exceptional 19.9% |
| Immigrants | Syria | 96.7 /100 | #107 | Exceptional 19.9% |
| Native Hawaiians | 96.6 /100 | #108 | Exceptional 19.9% |
| Colombians | 96.6 /100 | #109 | Exceptional 19.9% |