Tongan vs Bhutanese Single Female Poverty
COMPARE
Tongan
Bhutanese
Single Female Poverty
Single Female Poverty Comparison
Tongans
Bhutanese
18.8%
SINGLE FEMALE POVERTY
99.9/ 100
METRIC RATING
38th/ 347
METRIC RANK
17.7%
SINGLE FEMALE POVERTY
100.0/ 100
METRIC RATING
9th/ 347
METRIC RANK
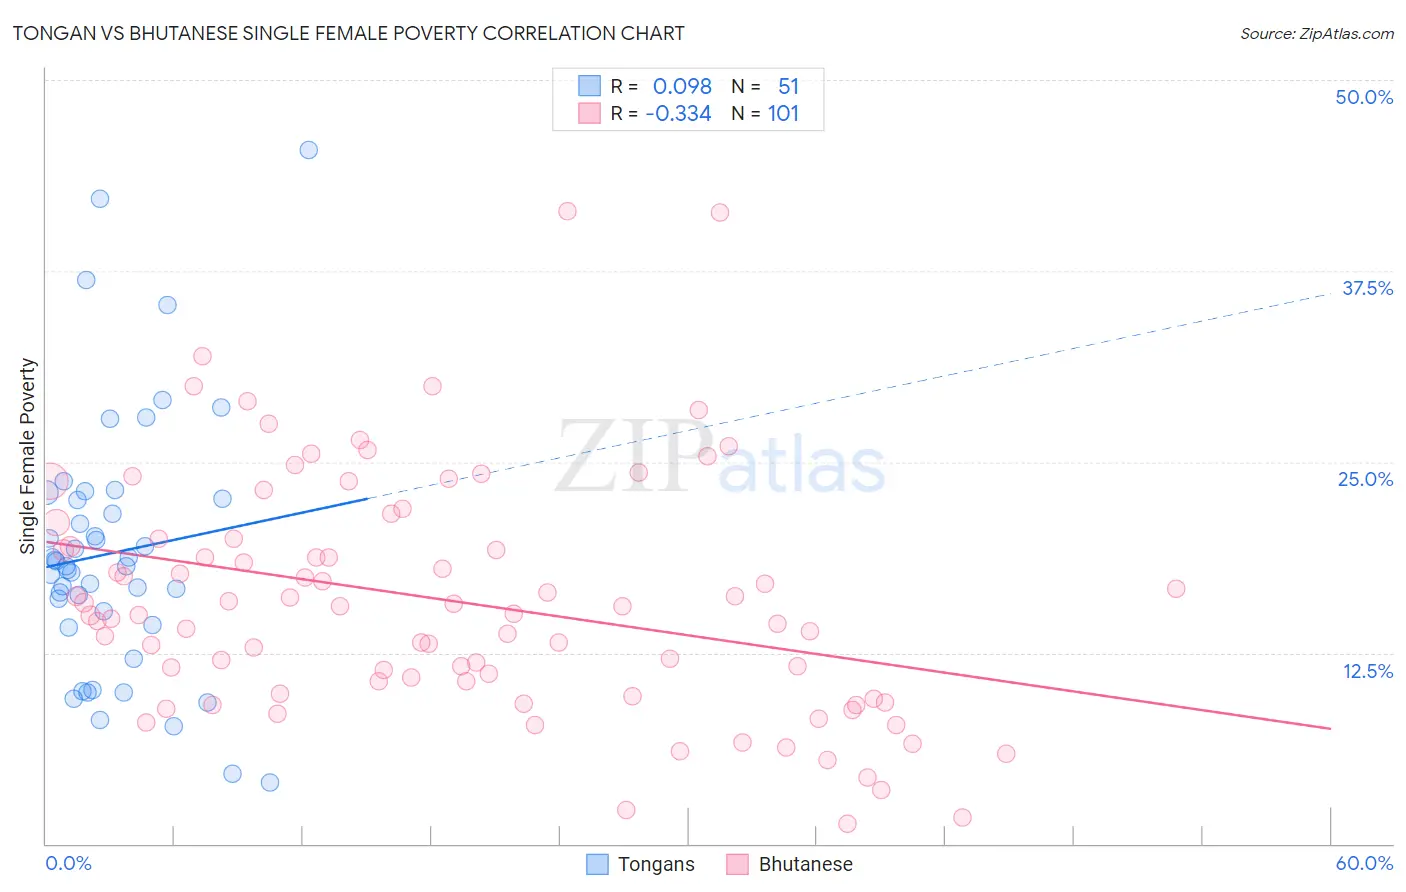
Tongan vs Bhutanese Single Female Poverty Correlation Chart
The statistical analysis conducted on geographies consisting of 102,377,778 people shows a slight positive correlation between the proportion of Tongans and poverty level among single females in the United States with a correlation coefficient (R) of 0.098 and weighted average of 18.8%. Similarly, the statistical analysis conducted on geographies consisting of 446,564,428 people shows a mild negative correlation between the proportion of Bhutanese and poverty level among single females in the United States with a correlation coefficient (R) of -0.334 and weighted average of 17.7%, a difference of 6.1%.
Single Female Poverty Correlation Summary
| Measurement | Tongan | Bhutanese |
| Minimum | 4.0% | 1.3% |
| Maximum | 45.5% | 41.4% |
| Range | 41.5% | 40.1% |
| Mean | 19.1% | 15.9% |
| Median | 18.2% | 15.1% |
| Interquartile 25% (IQ1) | 14.3% | 10.2% |
| Interquartile 75% (IQ3) | 22.6% | 19.9% |
| Interquartile Range (IQR) | 8.2% | 9.7% |
| Standard Deviation (Sample) | 8.5% | 7.8% |
| Standard Deviation (Population) | 8.4% | 7.8% |
Similar Demographics by Single Female Poverty
Demographics Similar to Tongans by Single Female Poverty
In terms of single female poverty, the demographic groups most similar to Tongans are Bulgarian (18.8%, a difference of 0.030%), Okinawan (18.8%, a difference of 0.060%), Immigrants from Serbia (18.8%, a difference of 0.080%), Jordanian (18.8%, a difference of 0.16%), and Immigrants from Romania (18.8%, a difference of 0.31%).
| Demographics | Rating | Rank | Single Female Poverty |
| Immigrants | Asia | 99.9 /100 | #31 | Exceptional 18.6% |
| Immigrants | Sri Lanka | 99.9 /100 | #32 | Exceptional 18.6% |
| Immigrants | Philippines | 99.9 /100 | #33 | Exceptional 18.6% |
| Koreans | 99.9 /100 | #34 | Exceptional 18.6% |
| Immigrants | Japan | 99.9 /100 | #35 | Exceptional 18.6% |
| Turks | 99.9 /100 | #36 | Exceptional 18.7% |
| Immigrants | Armenia | 99.9 /100 | #37 | Exceptional 18.7% |
| Tongans | 99.9 /100 | #38 | Exceptional 18.8% |
| Bulgarians | 99.9 /100 | #39 | Exceptional 18.8% |
| Okinawans | 99.9 /100 | #40 | Exceptional 18.8% |
| Immigrants | Serbia | 99.9 /100 | #41 | Exceptional 18.8% |
| Jordanians | 99.9 /100 | #42 | Exceptional 18.8% |
| Immigrants | Romania | 99.9 /100 | #43 | Exceptional 18.8% |
| Immigrants | Croatia | 99.9 /100 | #44 | Exceptional 18.9% |
| Immigrants | Indonesia | 99.8 /100 | #45 | Exceptional 18.9% |
Demographics Similar to Bhutanese by Single Female Poverty
In terms of single female poverty, the demographic groups most similar to Bhutanese are Immigrants from Ireland (17.8%, a difference of 0.41%), Immigrants from Lithuania (17.8%, a difference of 0.50%), Immigrants from South Central Asia (17.8%, a difference of 0.56%), Immigrants from Bolivia (17.8%, a difference of 0.82%), and Bolivian (17.9%, a difference of 1.3%).
| Demographics | Rating | Rank | Single Female Poverty |
| Immigrants | Taiwan | 100.0 /100 | #2 | Exceptional 16.4% |
| Immigrants | Hong Kong | 100.0 /100 | #3 | Exceptional 16.5% |
| Immigrants | India | 100.0 /100 | #4 | Exceptional 16.8% |
| Assyrians/Chaldeans/Syriacs | 100.0 /100 | #5 | Exceptional 17.0% |
| Filipinos | 100.0 /100 | #6 | Exceptional 17.0% |
| Thais | 100.0 /100 | #7 | Exceptional 17.3% |
| Immigrants | Iran | 100.0 /100 | #8 | Exceptional 17.5% |
| Bhutanese | 100.0 /100 | #9 | Exceptional 17.7% |
| Immigrants | Ireland | 100.0 /100 | #10 | Exceptional 17.8% |
| Immigrants | Lithuania | 100.0 /100 | #11 | Exceptional 17.8% |
| Immigrants | South Central Asia | 100.0 /100 | #12 | Exceptional 17.8% |
| Immigrants | Bolivia | 100.0 /100 | #13 | Exceptional 17.8% |
| Bolivians | 100.0 /100 | #14 | Exceptional 17.9% |
| Indians (Asian) | 100.0 /100 | #15 | Exceptional 17.9% |
| Iranians | 100.0 /100 | #16 | Exceptional 18.0% |