Guyanese vs Immigrants from Western Africa Single Female Poverty
COMPARE
Guyanese
Immigrants from Western Africa
Single Female Poverty
Single Female Poverty Comparison
Guyanese
Immigrants from Western Africa
21.0%
SINGLE FEMALE POVERTY
52.0/ 100
METRIC RATING
172nd/ 347
METRIC RANK
22.0%
SINGLE FEMALE POVERTY
5.3/ 100
METRIC RATING
230th/ 347
METRIC RANK
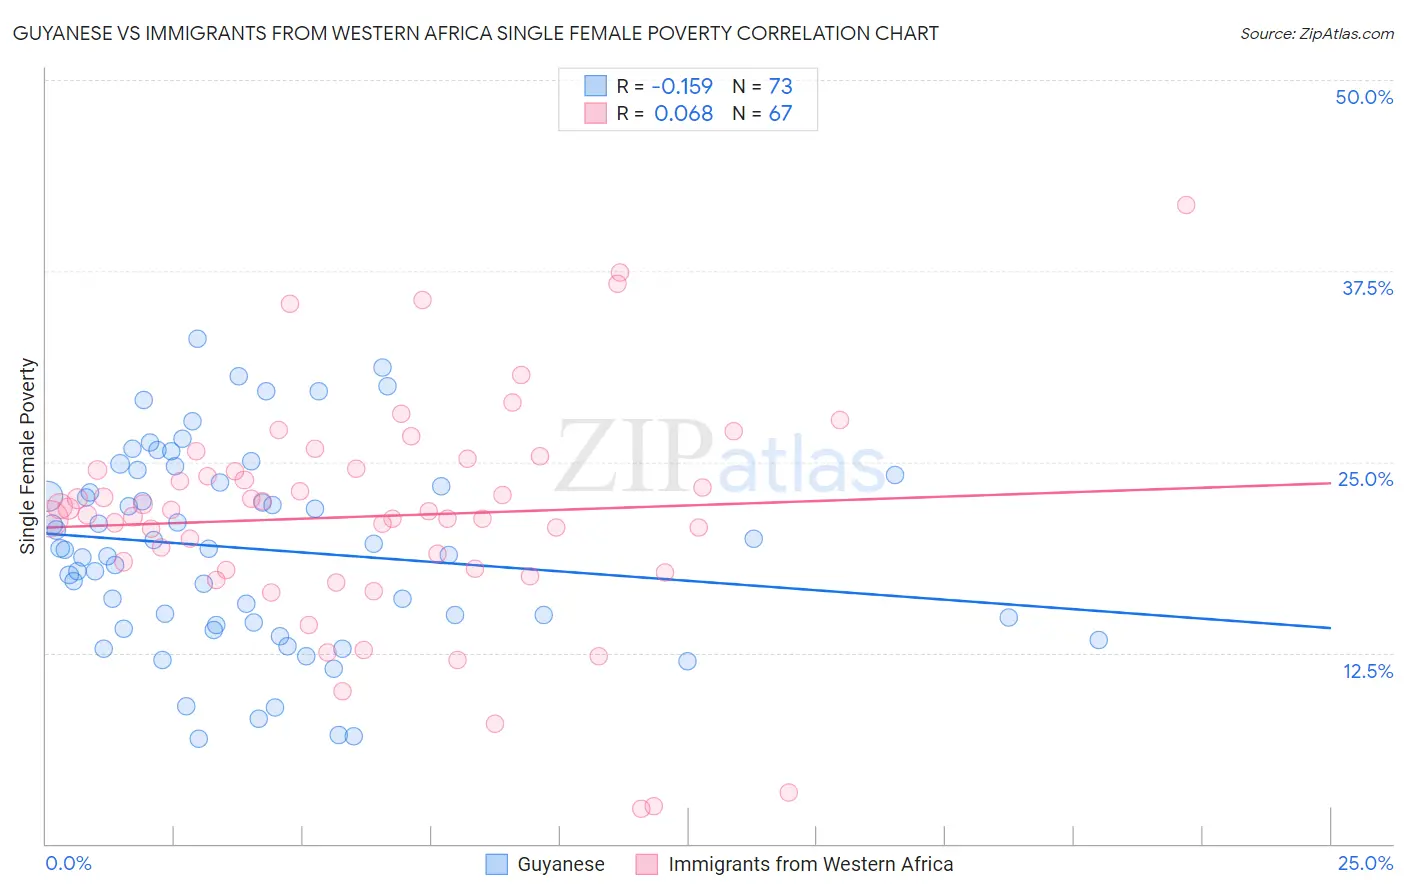
Guyanese vs Immigrants from Western Africa Single Female Poverty Correlation Chart
The statistical analysis conducted on geographies consisting of 175,255,160 people shows a poor negative correlation between the proportion of Guyanese and poverty level among single females in the United States with a correlation coefficient (R) of -0.159 and weighted average of 21.0%. Similarly, the statistical analysis conducted on geographies consisting of 354,181,306 people shows a slight positive correlation between the proportion of Immigrants from Western Africa and poverty level among single females in the United States with a correlation coefficient (R) of 0.068 and weighted average of 22.0%, a difference of 4.6%.
Single Female Poverty Correlation Summary
| Measurement | Guyanese | Immigrants from Western Africa |
| Minimum | 6.8% | 2.3% |
| Maximum | 33.1% | 41.8% |
| Range | 26.2% | 39.5% |
| Mean | 19.3% | 21.4% |
| Median | 19.3% | 21.8% |
| Interquartile 25% (IQ1) | 14.4% | 18.0% |
| Interquartile 75% (IQ3) | 23.9% | 24.5% |
| Interquartile Range (IQR) | 9.5% | 6.6% |
| Standard Deviation (Sample) | 6.3% | 7.4% |
| Standard Deviation (Population) | 6.3% | 7.4% |
Similar Demographics by Single Female Poverty
Demographics Similar to Guyanese by Single Female Poverty
In terms of single female poverty, the demographic groups most similar to Guyanese are Moroccan (21.0%, a difference of 0.050%), New Zealander (21.0%, a difference of 0.070%), Immigrants from Guyana (21.0%, a difference of 0.090%), Cuban (21.0%, a difference of 0.13%), and Immigrants from Trinidad and Tobago (20.9%, a difference of 0.27%).
| Demographics | Rating | Rank | Single Female Poverty |
| Ugandans | 64.0 /100 | #165 | Good 20.8% |
| Norwegians | 63.0 /100 | #166 | Good 20.8% |
| Immigrants | Norway | 63.0 /100 | #167 | Good 20.8% |
| Immigrants | Costa Rica | 61.5 /100 | #168 | Good 20.9% |
| Immigrants | Trinidad and Tobago | 56.3 /100 | #169 | Average 20.9% |
| New Zealanders | 53.2 /100 | #170 | Average 21.0% |
| Moroccans | 52.8 /100 | #171 | Average 21.0% |
| Guyanese | 52.0 /100 | #172 | Average 21.0% |
| Immigrants | Guyana | 50.6 /100 | #173 | Average 21.0% |
| Cubans | 50.0 /100 | #174 | Average 21.0% |
| Czechs | 46.8 /100 | #175 | Average 21.0% |
| Canadians | 45.4 /100 | #176 | Average 21.1% |
| Scandinavians | 45.2 /100 | #177 | Average 21.1% |
| Immigrants | Bosnia and Herzegovina | 44.9 /100 | #178 | Average 21.1% |
| British | 42.9 /100 | #179 | Average 21.1% |
Demographics Similar to Immigrants from Western Africa by Single Female Poverty
In terms of single female poverty, the demographic groups most similar to Immigrants from Western Africa are Tlingit-Haida (21.9%, a difference of 0.020%), Salvadoran (21.9%, a difference of 0.050%), Welsh (22.0%, a difference of 0.090%), Immigrants from Thailand (22.0%, a difference of 0.10%), and Immigrants from Ghana (21.9%, a difference of 0.14%).
| Demographics | Rating | Rank | Single Female Poverty |
| Scottish | 7.3 /100 | #223 | Tragic 21.8% |
| Barbadians | 7.2 /100 | #224 | Tragic 21.8% |
| English | 6.4 /100 | #225 | Tragic 21.9% |
| Immigrants | Portugal | 5.8 /100 | #226 | Tragic 21.9% |
| Immigrants | Ghana | 5.8 /100 | #227 | Tragic 21.9% |
| Salvadorans | 5.5 /100 | #228 | Tragic 21.9% |
| Tlingit-Haida | 5.4 /100 | #229 | Tragic 21.9% |
| Immigrants | Western Africa | 5.3 /100 | #230 | Tragic 22.0% |
| Welsh | 5.0 /100 | #231 | Tragic 22.0% |
| Immigrants | Thailand | 5.0 /100 | #232 | Tragic 22.0% |
| Spaniards | 4.7 /100 | #233 | Tragic 22.0% |
| Spanish | 4.7 /100 | #234 | Tragic 22.0% |
| Dutch | 4.6 /100 | #235 | Tragic 22.0% |
| Immigrants | Ecuador | 4.2 /100 | #236 | Tragic 22.0% |
| Vietnamese | 4.0 /100 | #237 | Tragic 22.0% |